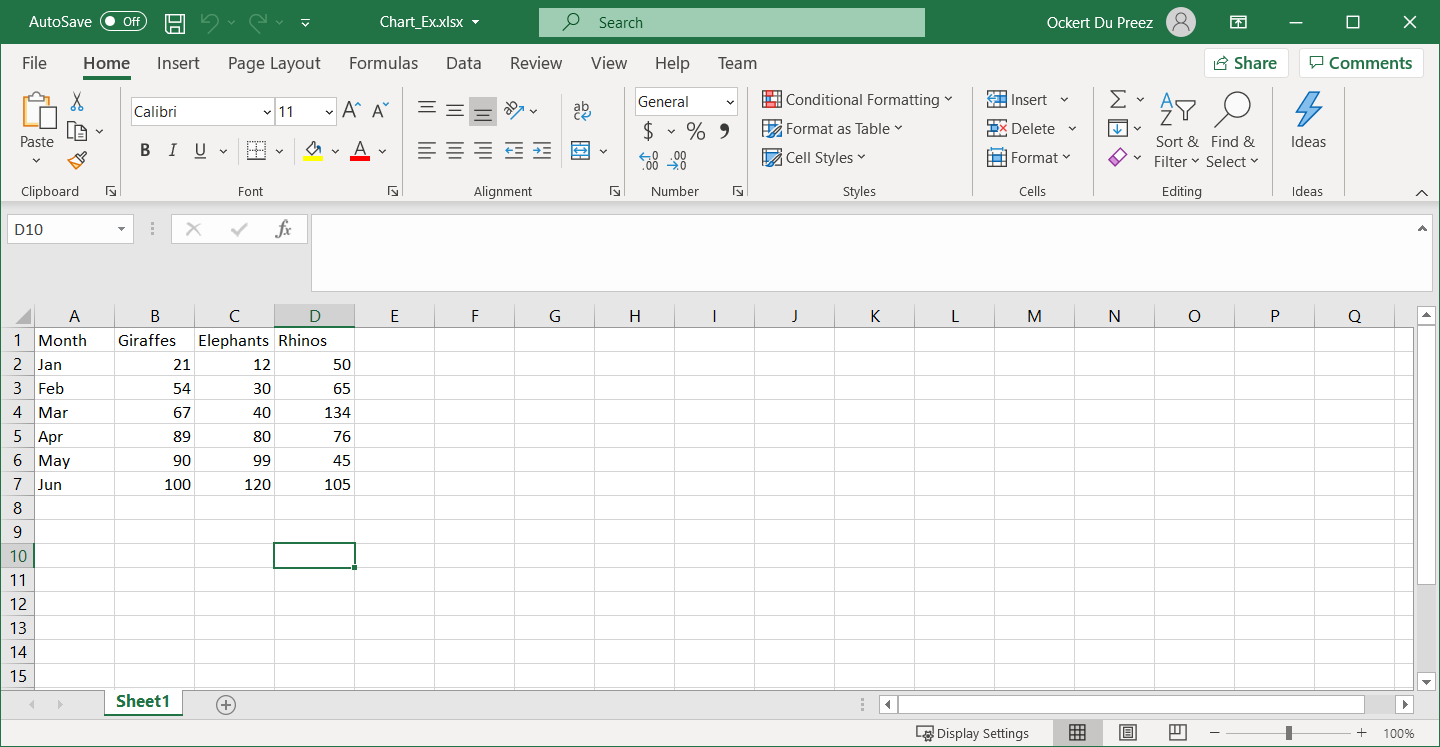
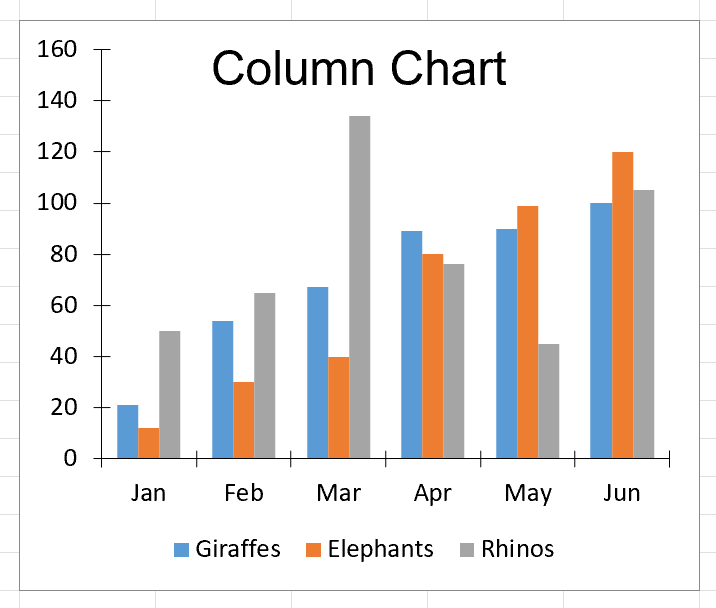
using IronXL;using IronXL.Drawing.Charts;// Load the existing Excel workbookWorkBook wb = WorkBook.Load("Chart_Ex.xlsx");// Use the default worksheet from the workbookWorkSheet ws = wb.DefaultWorkSheet;// Create a column chart at the specified range of cellsvar chart = ws.CreateChart(ChartType.Column, 10, 15, 25, 20);// Define the range for the x-axis dataconst string xAxis = "A2:A7";// Add a series for the chart using data in the range and give it a title from the first rowvar series = chart.AddSeries(xAxis, "B2:B7");series.Title = ws["B1"].StringValue;// Add another seriesseries = chart.AddSeries(xAxis, "C2:C7");series.Title = ws["C1"].StringValue;// Add a third seriesseries = chart.AddSeries(xAxis, "D2:D7");series.Title = ws["D1"].StringValue;// Set the chart titlechart.SetTitle("Column Chart");// Position the legend at the bottom of the chartchart.SetLegendPosition(LegendPosition.Bottom);// Plot the chart with the provided datachart.Plot();// Save the workbook with the newly added chartwb.SaveAs("Exported_Column_Chart.xlsx");
using IronXL;
using IronXL.Drawing.Charts;
// Load the existing Excel workbook
WorkBook wb = WorkBook.Load("Chart_Ex.xlsx");
// Use the default worksheet from the workbook
WorkSheet ws = wb.DefaultWorkSheet;
// Create a column chart at the specified range of cells
var chart = ws.CreateChart(ChartType.Column, 10, 15, 25, 20);
// Define the range for the x-axis data
const string xAxis = "A2:A7";
// Add a series for the chart using data in the range and give it a title from the first row
var series = chart.AddSeries(xAxis, "B2:B7");
series.Title = ws["B1"].StringValue;
// Add another series
series = chart.AddSeries(xAxis, "C2:C7");
series.Title = ws["C1"].StringValue;
// Add a third series
series = chart.AddSeries(xAxis, "D2:D7");
series.Title = ws["D1"].StringValue;
// Set the chart title
chart.SetTitle("Column Chart");
// Position the legend at the bottom of the chart
chart.SetLegendPosition(LegendPosition.Bottom);
// Plot the chart with the provided data
chart.Plot();
// Save the workbook with the newly added chart
wb.SaveAs("Exported_Column_Chart.xlsx");
ImportsIronXLImportsIronXL.Drawing.Charts' Load the existing Excel workbookDim wb AsWorkBook = WorkBook.Load("Chart_Ex.xlsx")' Use the default worksheet from the workbookDim ws AsWorkSheet = wb.DefaultWorkSheet' Create a column chart at the specified range of cellsDim chart = ws.CreateChart(ChartType.Column, 10, 15, 25, 20)' Define the range for the x-axis dataConst xAxis AsString = "A2:A7"' Add a series for the chart using data in the range and give it a title from the first rowDim series = chart.AddSeries(xAxis, "B2:B7")series.Title = ws("B1").StringValue' Add another seriesseries = chart.AddSeries(xAxis, "C2:C7")series.Title = ws("C1").StringValue' Add a third seriesseries = chart.AddSeries(xAxis, "D2:D7")series.Title = ws("D1").StringValue' Set the chart titlechart.SetTitle("Column Chart")' Position the legend at the bottom of the chartchart.SetLegendPosition(LegendPosition.Bottom)' Plot the chart with the provided datachart.Plot()' Save the workbook with the newly added chartwb.SaveAs("Exported_Column_Chart.xlsx")
Imports IronXL
Imports IronXL.Drawing.Charts
' Load the existing Excel workbook
Dim wb As WorkBook = WorkBook.Load("Chart_Ex.xlsx")
' Use the default worksheet from the workbook
Dim ws As WorkSheet = wb.DefaultWorkSheet
' Create a column chart at the specified range of cells
Dim chart = ws.CreateChart(ChartType.Column, 10, 15, 25, 20)
' Define the range for the x-axis data
Const xAxis As String = "A2:A7"
' Add a series for the chart using data in the range and give it a title from the first row
Dim series = chart.AddSeries(xAxis, "B2:B7")
series.Title = ws("B1").StringValue
' Add another series
series = chart.AddSeries(xAxis, "C2:C7")
series.Title = ws("C1").StringValue
' Add a third series
series = chart.AddSeries(xAxis, "D2:D7")
series.Title = ws("D1").StringValue
' Set the chart title
chart.SetTitle("Column Chart")
' Position the legend at the bottom of the chart
chart.SetLegendPosition(LegendPosition.Bottom)
' Plot the chart with the provided data
chart.Plot()
' Save the workbook with the newly added chart
wb.SaveAs("Exported_Column_Chart.xlsx")
// Create a line chart for trend analysisvar lineChart = ws.CreateChart(ChartType.Line, 10, 22, 25, 32);// Add data series with smooth linesvar trendSeries = lineChart.AddSeries("A2:A7", "B2:B7");trendSeries.Title = "Q1 Sales Trend";// Customize chart appearancelineChart.SetTitle("Quarterly Sales Trend Analysis");lineChart.SetLegendPosition(LegendPosition.Right);// You can also create combination chartsvar comboChart = ws.CreateChart(ChartType.ColumnClustered, 27, 15, 42, 25);comboChart.AddSeries("A2:A7", "B2:B7"); // Column seriescomboChart.AddSeries("A2:A7", "C2:C7"); // Can be styled as linecomboChart.Plot();
// Create a line chart for trend analysis
var lineChart = ws.CreateChart(ChartType.Line, 10, 22, 25, 32);

// Add data series with smooth lines
var trendSeries = lineChart.AddSeries("A2:A7", "B2:B7");
trendSeries.Title = "Q1 Sales Trend";

// Customize chart appearance
lineChart.SetTitle("Quarterly Sales Trend Analysis");
lineChart.SetLegendPosition(LegendPosition.Right);

// You can also create combination charts
var comboChart = ws.CreateChart(ChartType.ColumnClustered, 27, 15, 42, 25);
comboChart.AddSeries("A2:A7", "B2:B7"); // Column series
comboChart.AddSeries("A2:A7", "C2:C7"); // Can be styled as line

comboChart.Plot();
' Create a line chart for trend analysisDim lineChart = ws.CreateChart(ChartType.Line, 10, 22, 25, 32)' Add data series with smooth linesDim trendSeries = lineChart.AddSeries("A2:A7", "B2:B7")trendSeries.Title = "Q1 Sales Trend"' Customize chart appearancelineChart.SetTitle("Quarterly Sales Trend Analysis")lineChart.SetLegendPosition(LegendPosition.Right)' You can also create combination chartsDim comboChart = ws.CreateChart(ChartType.ColumnClustered, 27, 15, 42, 25)comboChart.AddSeries("A2:A7", "B2:B7") ' Column seriescomboChart.AddSeries("A2:A7", "C2:C7") ' Can be styled as linecomboChart.Plot()
' Create a line chart for trend analysis
Dim lineChart = ws.CreateChart(ChartType.Line, 10, 22, 25, 32)

' Add data series with smooth lines
Dim trendSeries = lineChart.AddSeries("A2:A7", "B2:B7")
trendSeries.Title = "Q1 Sales Trend"

' Customize chart appearance
lineChart.SetTitle("Quarterly Sales Trend Analysis")
lineChart.SetLegendPosition(LegendPosition.Right)

' You can also create combination charts
Dim comboChart = ws.CreateChart(ChartType.ColumnClustered, 27, 15, 42, 25)
comboChart.AddSeries("A2:A7", "B2:B7") ' Column series
comboChart.AddSeries("A2:A7", "C2:C7") ' Can be styled as line

comboChart.Plot()
IronXL provides extensive customization options for charts, including modifying colors, adding data labels, adjusting axis scales, and applying different formatting styles. This allows you to create visually appealing and informative Excel charts.
What is the advantage of using the IronXL library for Excel chart creation?
IronXL simplifies the process of creating and managing Excel charts programmatically in C#. It handles complex Excel XML formatting, supports various chart types, offers extensive customization, and provides efficient memory management for large files, allowing developers to focus on business logic.