# Excel 차트를 만드는 방법 C#
데이터 시리즈 추가, 제목 및 범례 구성, 그리고 `Plot()` 메서드를 사용하여 플로팅하여 5줄의 코드로 완전한 Excel 시각화를 통해서 IronXL을 사용하여 C#에서 @ `CreateChart()` 메서드를 호출하여 Excel 차트를 만들 수 있습니다.
*as-heading:2(시작하기: C#에서 프로그래밍 방식으로 Excel 차트 생성하기)*
IronXL에서 열 차트를 생성하세요: 단일 워크시트 메서드를 사용하여 차트를 만들고, 데이터 시리즈를 추가하고, 제목과 범례를 설정하고, 플롯한 다음 저장하세요. IronXL의 기능에 대한 종합적인 개요를 보려면 [Get Started Overview](https://ironsoftware.com/csharp/excel/docs/) 페이지를 방문하세요.
```cs
:title=Create Excel Chart in Seconds with IronXL
IChart chart = worksheet.CreateChart(ChartType.Column, 5, 5, 20, 10);
chart.AddSeries("A2:A7", "B2:B7");
chart.SetTitle("Sales Overview").SetLegendPosition(LegendPosition.Bottom).Plot();
workbook.SaveAs("SalesChart.xlsx");
```
### 최소 워크플로우 (6단계)
1. Excel 차트를 만들 Excel 라이브러리를 설치하세요.
2. 기존 Excel 파일을 `Workbook` 객체로 로드합니다.
3. `CreateChart` 로 차트를 생성합니다.
4. 차트의 제목과 범례를 설정하세요.
5. `Plot` 메서드를 호출합니다.
6. Excel 파일에 `Workbook` 을 저장합니다.
<div class="learnn-how-section">
<div class="row">
<div class="col-sm-6">
<h2>프로그램 방식으로 .NET에서 Excel 차트 생성하기</h2>
<ul class="list-unstyled">
<li>Excel 그래프를 프로그래밍 방식으로 생성하기</li>
<li>제목과 범례를 가진 시리즈 추가하기</li>
</ul>
</div>
<div class="col-sm-6">
<div class="download-card">
<img style="box-shadow: none; width: 308px; height: 320px;" src="/img/faq/excel/how-to-work.svg" class="img-responsive learn-how-to-img replaceable-img" />
</div>
</div>
</div>
</div>
<hr class="separator" />
<p class="main-content__segment-title">1단계</p>
## IronXL을 설치하여 Excel 차트 생성하는 방법은?
Visual Studio의 NuGet 패키지 관리자를 사용하여 IronXL을 설치하세요:
* 프로젝트 메뉴 선택
* NuGet 패키지 관리
* `IronXL.Excel` 검색
* 설치
이 설치는 [프로그래밍 방식으로 Excel 차트를 생성하는](https://ironsoftware.com/csharp/excel/how-to/csharp-create-excel-chart-programmatically/) 데 필요한 모든 도구를 제공합니다. IronXL은 열, 선, 원형, 막대, 영역 및 분산형 차트를 포함한 다양한 차트 유형을 지원합니다.
### NuGet 패키지 관리자를 사용하는 이유는?
Developer Command Prompt에 다음 명령을 입력할 수도 있습니다:
```shell
:ProductInstall
```
### 다른 설치 방법은 무엇인가요?
또는 여기에서 다운로드하세요: <a class="js-modal-open" href="/csharp/excel/packages/IronXL.zip" data-modal-id="trial-license-after-download">https://ironsoftware.com/csharp/excel/packages/IronXL.zip</a>
설치가 완료되면 IronXL을 사용하여 새로운 Excel 파일을 [처음부터 생성](https://ironsoftware.com/csharp/excel/examples/create-excel-spreadsheet/)하거나 기존 스프레드시트와 작업할 수 있으며, 이는 새로운 프로젝트와 기존 시스템 통합 모두에 적합합니다.
<hr class="separator" />
<p class="main-content__segment-title">튜토리얼 사용법</p>
## .NET에서 프로그래밍 방식으로 Excel 차트를 생성하는 방법은?
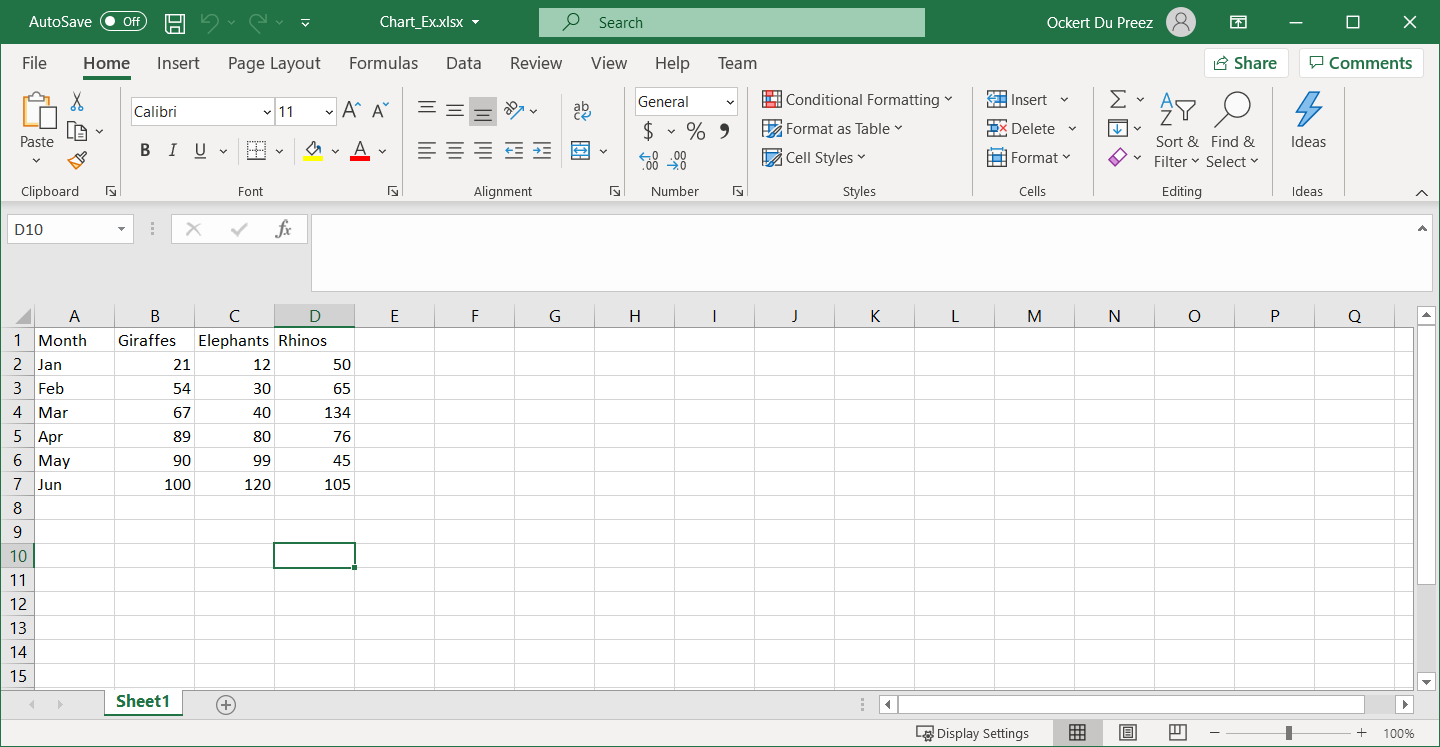
Excel 스프레드시트에 다음 데이터를 추가하세요:
<div class="content-img-align-center">
<div class="center-image-wrapper">
<a
href="/img/faq/excel/csharp-create-excel-chart-programmatically/data-to-be-used-for-charting.png"
target="_blank"
>
<img
class="img-responsive"
src="/img/faq/excel/csharp-create-excel-chart-programmatically/data-to-be-used-for-charting.png"
alt="Excel 스프레드시트에는 A부터 D 열까지 제품, 1분기 판매, 2분기 판매, 3분기 판매를 위한 헤더가 포함되어 있는 판매 데이터가 나타납니다." />
</a>
<p><strong>그림 1</strong> – <em>차트 작성에 사용될 데이터</em></p>
</div>
</div>
차트를 생성하기 전에 데이터가 적절히 정리되어 있는지 확인하세요. IronXL은 [기존 스프레드시트를 로드](https://ironsoftware.com/csharp/excel/how-to/load-spreadsheet/)할 수 있으며, 프로그램 방식으로 생성할 수도 있습니다. 이 라이브러리는 XLS, XLSX, CSV, TSV를 포함한 다양한 Excel 파일 형식을 지원합니다.
### Excel 차트를 위해 필요한 네임스페이스는 무엇인가요?
IronXL에서 Excel 차트 작업에 필요한 네임스페이스를 추가하세요:
```csharp
using IronXL;
using IronXL.Drawing.Charts;
```
이 네임스페이스는 모든 차트 관련 기능에 대한 액세스를 제공합니다. `IronXL` 네임스페이스는 핵심 워크북 및 워크시트 작업을 포함하며, `IronXL.Drawing.Charts` 는 차트 생성 및 사용자 정의 기능을 처리합니다.
### 내 차트에 여러 데이터 시리즈를 어떻게 추가하나요?
IronXL을 사용하여 Excel 그래프를 프로그래밍 방식으로 생성하는 코드를 추가하세요:
```csharp
using IronXL;
using IronXL.Drawing.Charts;
// Load the existing Excel workbook
WorkBook wb = WorkBook.Load("Chart_Ex.xlsx");
// Use the default worksheet from the workbook
WorkSheet ws = wb.DefaultWorkSheet;
// Create a column chart at the specified range of cells
var chart = ws.CreateChart(ChartType.Column, 10, 15, 25, 20);
// Define the range for the x-axis data
const string xAxis = "A2:A7";
// Add a series for the chart using data in the range and give it a title from the first row
var series = chart.AddSeries(xAxis, "B2:B7");
series.Title = ws["B1"].StringValue;
// Add another series
series = chart.AddSeries(xAxis, "C2:C7");
series.Title = ws["C1"].StringValue;
// Add a third series
series = chart.AddSeries(xAxis, "D2:D7");
series.Title = ws["D1"].StringValue;
// Set the chart title
chart.SetTitle("Column Chart");
// Position the legend at the bottom of the chart
chart.SetLegendPosition(LegendPosition.Bottom);
// Plot the chart with the provided data
chart.Plot();
// Save the workbook with the newly added chart
wb.SaveAs("Exported_Column_Chart.xlsx");
```
`CreateChart` 메서드는 차트 유형과 위치(왼쪽 열, 위쪽 행, 오른쪽 열, 아래쪽 행)에 대한 매개변수를 받습니다. 이 위치 지정은 셀 좌표를 사용하여 워크시트 내에 차트를 정확하게 배치합니다. 단일 워크시트에 여러 차트를 생성하거나 다른 시트에 분산시킬 수 있습니다.
데이터 시리즈 작업 시 IronXL은 표준 Excel 표기법을 사용하여 셀 범위를 참조할 수 있습니다. 이로 인해 Excel에 익숙한 개발자가 프로그래밍 방식으로 차트를 생성하는 것이 직관적입니다. 또한, [Excel 수식](https://ironsoftware.com/csharp/excel/examples/excel-formulas-csharp/)과 차트를 결합하여 데이터가 변경될 때 자동으로 업데이트되는 동적 시각화를 만들 수 있습니다.
### 다른 차트 유형을 어떻게 만들 수 있나요?
IronXL은 열 차트 외에도 다양한 차트 유형을 지원합니다. 다음은 사용자 정의 스타일을 사용하여 선 그래프를 생성하는 예입니다:
```csharp
// Create a line chart for trend analysis
var lineChart = ws.CreateChart(ChartType.Line, 10, 22, 25, 32);
// Add data series with smooth lines
var trendSeries = lineChart.AddSeries("A2:A7", "B2:B7");
trendSeries.Title = "Q1 Sales Trend";
// Customize chart appearance
lineChart.SetTitle("Quarterly Sales Trend Analysis");
lineChart.SetLegendPosition(LegendPosition.Right);
// You can also create combination charts
var comboChart = ws.CreateChart(ChartType.ColumnClustered, 27, 15, 42, 25);
comboChart.AddSeries("A2:A7", "B2:B7"); // Column series
comboChart.AddSeries("A2:A7", "C2:C7"); // Can be styled as line
comboChart.Plot();
```
### 최종 차트 출력은 어떻게 생겼나요?
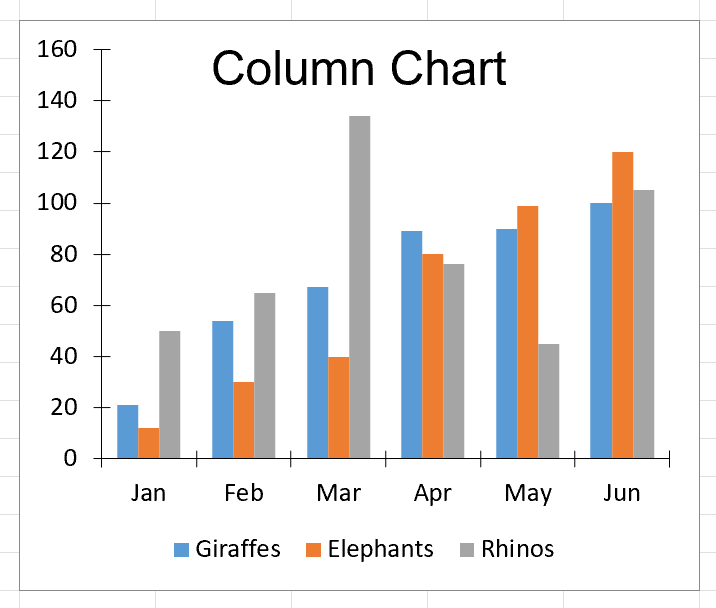
`Workbook` 객체 및 `Worksheet` 객체가 생성됩니다. `CreateChart` 메서드는 `Worksheet` 객체의 차트 유형 및 차트 위치 지정이 호출됩니다. 차트의 시리즈는 제목 및 범례와 함께 추가됩니다.
<div class="content-img-align-center">
<div class="center-image-wrapper">
<img
class="img-responsive"
src="/img/faq/excel/csharp-create-excel-chart-programmatically/chart-output.png"
alt="분기별 판매 데이터를 세 가지 시리즈로 표시하는 Excel 열 차트, 하단에 범례, 제목 'Column Chart'" />
<p><strong>Figure 2</strong> – <em>차트 출력</em></p>
</div>
</div>
생성된 차트는 데이터의 명확한 시각적 표현을 제공합니다. IronXL은 모든 복잡한 Excel XML 형식화를 백그라운드에서 처리하여 비즈니스 로직에 집중할 수 있도록 해줍니다. 차트 작성에 대한 더 많은 예시는 [Excel 차트 예제](https://ironsoftware.com/csharp/excel/examples/create-a-excel-line-chart/) 페이지를 참조하세요.
### 고급 차트 사용자 정의
기본 차트 작성 외에도 IronXL은 광범위한 사용자 정의 옵션을 제공합니다. 색상을 수정하고, 데이터 레이블을 추가하며, 축 스케일을 조정하고 다양한 형식 옵션을 적용할 수 있습니다. 라이브러리의 [저장 및 내보내기 기능](https://ironsoftware.com/csharp/excel/features/save-export/)은 차트가 다양한 Excel 형식 및 버전에서 올바르게 보존되도록 보장합니다.
대용량 데이터셋 작업 시 차트 작성 전에 페이지 매김 또는 데이터 필터링을 구현하는 것을 고려하세요. 이 방법은 최적의 성능을 보장하고 혼란스러운 시각화를 방지합니다. IronXL의 효율적인 메모리 관리를 통해 성능 저하 없이 대규모 Excel 파일을 다룰 수 있습니다.
<hr class="separator" />
<p class="main-content__segment-title">라이브러리 바로가기</p>
<div class="tutorial-section">
<div class="row">
<div class="col-sm-8">
<h3>IronXL API 참조 문서</h3>
<p>편리한 [IronXL API 참조 문서](https://ironsoftware.com/csharp/excel/object-reference/api/)를 사용하여 Excel 스프레드시트에서 셀을 병합, 병합 해제 및 작업하는 방법에 대해 자세히 알아보고 공유하세요.</p>
<a class="doc-link" href="/csharp/excel/object-reference/api/" target="_blank"> IronXL API 참조 문서 <i class="fa fa-chevron-right"></i></a>
</div>
<div class="col-sm-4">
<div class="tutorial-image">
<img style="max-width: 110px; width: 100px; height: 140px;" alt="" class="img-responsive add-shadow" src="/img/svgs/documentation.svg" width="100" height="140" />
</div>
</div>
</div>
</div>
데이터 시리즈 추가, 제목 및 범례 구성, 그리고 Plot() 메서드를 사용하여 플로팅하여 5줄의 코드로 완전한 Excel 시각화를 통해서 IronXL을 사용하여 C#에서 @ CreateChart() 메서드를 호출하여 Excel 차트를 만들 수 있습니다.
시작하기: C#에서 프로그래밍 방식으로 Excel 차트 생성하기
IronXL에서 열 차트를 생성하세요: 단일 워크시트 메서드를 사용하여 차트를 만들고, 데이터 시리즈를 추가하고, 제목과 범례를 설정하고, 플롯한 다음 저장하세요. IronXL의 기능에 대한 종합적인 개요를 보려면 Get Started Overview 페이지를 방문하세요.
설치가 완료되면 IronXL을 사용하여 새로운 Excel 파일을 처음부터 생성하거나 기존 스프레드시트와 작업할 수 있으며, 이는 새로운 프로젝트와 기존 시스템 통합 모두에 적합합니다.
튜토리얼 사용법
.NET에서 프로그래밍 방식으로 Excel 차트를 생성하는 방법은?
Excel 스프레드시트에 다음 데이터를 추가하세요:
그림 1 – 차트 작성에 사용될 데이터
차트를 생성하기 전에 데이터가 적절히 정리되어 있는지 확인하세요. IronXL은 기존 스프레드시트를 로드할 수 있으며, 프로그램 방식으로 생성할 수도 있습니다. 이 라이브러리는 XLS, XLSX, CSV, TSV를 포함한 다양한 Excel 파일 형식을 지원합니다.
Excel 차트를 위해 필요한 네임스페이스는 무엇인가요?
IronXL에서 Excel 차트 작업에 필요한 네임스페이스를 추가하세요:
using IronXL;using IronXL.Drawing.Charts;
using IronXL;
using IronXL.Drawing.Charts;
ImportsIronXLImportsIronXL.Drawing.Charts
Imports IronXL
Imports IronXL.Drawing.Charts
이 네임스페이스는 모든 차트 관련 기능에 대한 액세스를 제공합니다. IronXL 네임스페이스는 핵심 워크북 및 워크시트 작업을 포함하며, IronXL.Drawing.Charts 는 차트 생성 및 사용자 정의 기능을 처리합니다.
내 차트에 여러 데이터 시리즈를 어떻게 추가하나요?
IronXL을 사용하여 Excel 그래프를 프로그래밍 방식으로 생성하는 코드를 추가하세요:
using IronXL;using IronXL.Drawing.Charts;// Load the existing Excel workbookWorkBook wb = WorkBook.Load("Chart_Ex.xlsx");// Use the default worksheet from the workbookWorkSheet ws = wb.DefaultWorkSheet;// Create a column chart at the specified range of cellsvar chart = ws.CreateChart(ChartType.Column, 10, 15, 25, 20);// Define the range for the x-axis dataconst string xAxis = "A2:A7";// Add a series for the chart using data in the range and give it a title from the first rowvar series = chart.AddSeries(xAxis, "B2:B7");series.Title = ws["B1"].StringValue;// Add another seriesseries = chart.AddSeries(xAxis, "C2:C7");series.Title = ws["C1"].StringValue;// Add a third seriesseries = chart.AddSeries(xAxis, "D2:D7");series.Title = ws["D1"].StringValue;// Set the chart titlechart.SetTitle("Column Chart");// Position the legend at the bottom of the chartchart.SetLegendPosition(LegendPosition.Bottom);// Plot the chart with the provided datachart.Plot();// Save the workbook with the newly added chartwb.SaveAs("Exported_Column_Chart.xlsx");
using IronXL;
using IronXL.Drawing.Charts;
// Load the existing Excel workbook
WorkBook wb = WorkBook.Load("Chart_Ex.xlsx");
// Use the default worksheet from the workbook
WorkSheet ws = wb.DefaultWorkSheet;
// Create a column chart at the specified range of cells
var chart = ws.CreateChart(ChartType.Column, 10, 15, 25, 20);
// Define the range for the x-axis data
const string xAxis = "A2:A7";
// Add a series for the chart using data in the range and give it a title from the first row
var series = chart.AddSeries(xAxis, "B2:B7");
series.Title = ws["B1"].StringValue;
// Add another series
series = chart.AddSeries(xAxis, "C2:C7");
series.Title = ws["C1"].StringValue;
// Add a third series
series = chart.AddSeries(xAxis, "D2:D7");
series.Title = ws["D1"].StringValue;
// Set the chart title
chart.SetTitle("Column Chart");
// Position the legend at the bottom of the chart
chart.SetLegendPosition(LegendPosition.Bottom);
// Plot the chart with the provided data
chart.Plot();
// Save the workbook with the newly added chart
wb.SaveAs("Exported_Column_Chart.xlsx");
ImportsIronXLImportsIronXL.Drawing.Charts' Load the existing Excel workbookDim wb AsWorkBook = WorkBook.Load("Chart_Ex.xlsx")' Use the default worksheet from the workbookDim ws AsWorkSheet = wb.DefaultWorkSheet' Create a column chart at the specified range of cellsDim chart = ws.CreateChart(ChartType.Column, 10, 15, 25, 20)' Define the range for the x-axis dataConst xAxis AsString = "A2:A7"' Add a series for the chart using data in the range and give it a title from the first rowDim series = chart.AddSeries(xAxis, "B2:B7")series.Title = ws("B1").StringValue' Add another seriesseries = chart.AddSeries(xAxis, "C2:C7")series.Title = ws("C1").StringValue' Add a third seriesseries = chart.AddSeries(xAxis, "D2:D7")series.Title = ws("D1").StringValue' Set the chart titlechart.SetTitle("Column Chart")' Position the legend at the bottom of the chartchart.SetLegendPosition(LegendPosition.Bottom)' Plot the chart with the provided datachart.Plot()' Save the workbook with the newly added chartwb.SaveAs("Exported_Column_Chart.xlsx")
Imports IronXL
Imports IronXL.Drawing.Charts
' Load the existing Excel workbook
Dim wb As WorkBook = WorkBook.Load("Chart_Ex.xlsx")
' Use the default worksheet from the workbook
Dim ws As WorkSheet = wb.DefaultWorkSheet
' Create a column chart at the specified range of cells
Dim chart = ws.CreateChart(ChartType.Column, 10, 15, 25, 20)
' Define the range for the x-axis data
Const xAxis As String = "A2:A7"
' Add a series for the chart using data in the range and give it a title from the first row
Dim series = chart.AddSeries(xAxis, "B2:B7")
series.Title = ws("B1").StringValue
' Add another series
series = chart.AddSeries(xAxis, "C2:C7")
series.Title = ws("C1").StringValue
' Add a third series
series = chart.AddSeries(xAxis, "D2:D7")
series.Title = ws("D1").StringValue
' Set the chart title
chart.SetTitle("Column Chart")
' Position the legend at the bottom of the chart
chart.SetLegendPosition(LegendPosition.Bottom)
' Plot the chart with the provided data
chart.Plot()
' Save the workbook with the newly added chart
wb.SaveAs("Exported_Column_Chart.xlsx")
CreateChart 메서드는 차트 유형과 위치(왼쪽 열, 위쪽 행, 오른쪽 열, 아래쪽 행)에 대한 매개변수를 받습니다. 이 위치 지정은 셀 좌표를 사용하여 워크시트 내에 차트를 정확하게 배치합니다. 단일 워크시트에 여러 차트를 생성하거나 다른 시트에 분산시킬 수 있습니다.
데이터 시리즈 작업 시 IronXL은 표준 Excel 표기법을 사용하여 셀 범위를 참조할 수 있습니다. 이로 인해 Excel에 익숙한 개발자가 프로그래밍 방식으로 차트를 생성하는 것이 직관적입니다. 또한, Excel 수식과 차트를 결합하여 데이터가 변경될 때 자동으로 업데이트되는 동적 시각화를 만들 수 있습니다.
다른 차트 유형을 어떻게 만들 수 있나요?
IronXL은 열 차트 외에도 다양한 차트 유형을 지원합니다. 다음은 사용자 정의 스타일을 사용하여 선 그래프를 생성하는 예입니다:
// Create a line chart for trend analysisvar lineChart = ws.CreateChart(ChartType.Line, 10, 22, 25, 32);// Add data series with smooth linesvar trendSeries = lineChart.AddSeries("A2:A7", "B2:B7");trendSeries.Title = "Q1 Sales Trend";// Customize chart appearancelineChart.SetTitle("Quarterly Sales Trend Analysis");lineChart.SetLegendPosition(LegendPosition.Right);// You can also create combination chartsvar comboChart = ws.CreateChart(ChartType.ColumnClustered, 27, 15, 42, 25);comboChart.AddSeries("A2:A7", "B2:B7"); // Column seriescomboChart.AddSeries("A2:A7", "C2:C7"); // Can be styled as linecomboChart.Plot();
// Create a line chart for trend analysis
var lineChart = ws.CreateChart(ChartType.Line, 10, 22, 25, 32);

// Add data series with smooth lines
var trendSeries = lineChart.AddSeries("A2:A7", "B2:B7");
trendSeries.Title = "Q1 Sales Trend";

// Customize chart appearance
lineChart.SetTitle("Quarterly Sales Trend Analysis");
lineChart.SetLegendPosition(LegendPosition.Right);

// You can also create combination charts
var comboChart = ws.CreateChart(ChartType.ColumnClustered, 27, 15, 42, 25);
comboChart.AddSeries("A2:A7", "B2:B7"); // Column series
comboChart.AddSeries("A2:A7", "C2:C7"); // Can be styled as line

comboChart.Plot();
' Create a line chart for trend analysisDim lineChart = ws.CreateChart(ChartType.Line, 10, 22, 25, 32)' Add data series with smooth linesDim trendSeries = lineChart.AddSeries("A2:A7", "B2:B7")trendSeries.Title = "Q1 Sales Trend"' Customize chart appearancelineChart.SetTitle("Quarterly Sales Trend Analysis")lineChart.SetLegendPosition(LegendPosition.Right)' You can also create combination chartsDim comboChart = ws.CreateChart(ChartType.ColumnClustered, 27, 15, 42, 25)comboChart.AddSeries("A2:A7", "B2:B7") ' Column seriescomboChart.AddSeries("A2:A7", "C2:C7") ' Can be styled as linecomboChart.Plot()
' Create a line chart for trend analysis
Dim lineChart = ws.CreateChart(ChartType.Line, 10, 22, 25, 32)

' Add data series with smooth lines
Dim trendSeries = lineChart.AddSeries("A2:A7", "B2:B7")
trendSeries.Title = "Q1 Sales Trend"

' Customize chart appearance
lineChart.SetTitle("Quarterly Sales Trend Analysis")
lineChart.SetLegendPosition(LegendPosition.Right)

' You can also create combination charts
Dim comboChart = ws.CreateChart(ChartType.ColumnClustered, 27, 15, 42, 25)
comboChart.AddSeries("A2:A7", "B2:B7") ' Column series
comboChart.AddSeries("A2:A7", "C2:C7") ' Can be styled as line

comboChart.Plot()
최종 차트 출력은 어떻게 생겼나요?
Workbook 객체 및 Worksheet 객체가 생성됩니다. CreateChart 메서드는 Worksheet 객체의 차트 유형 및 차트 위치 지정이 호출됩니다. 차트의 시리즈는 제목 및 범례와 함께 추가됩니다.
Figure 2 – 차트 출력
생성된 차트는 데이터의 명확한 시각적 표현을 제공합니다. IronXL은 모든 복잡한 Excel XML 형식화를 백그라운드에서 처리하여 비즈니스 로직에 집중할 수 있도록 해줍니다. 차트 작성에 대한 더 많은 예시는 Excel 차트 예제 페이지를 참조하세요.
고급 차트 사용자 정의
기본 차트 작성 외에도 IronXL은 광범위한 사용자 정의 옵션을 제공합니다. 색상을 수정하고, 데이터 레이블을 추가하며, 축 스케일을 조정하고 다양한 형식 옵션을 적용할 수 있습니다. 라이브러리의 저장 및 내보내기 기능은 차트가 다양한 Excel 형식 및 버전에서 올바르게 보존되도록 보장합니다.
대용량 데이터셋 작업 시 차트 작성 전에 페이지 매김 또는 데이터 필터링을 구현하는 것을 고려하세요. 이 방법은 최적의 성능을 보장하고 혼란스러운 시각화를 방지합니다. IronXL의 효율적인 메모리 관리를 통해 성능 저하 없이 대규모 Excel 파일을 다룰 수 있습니다.
라이브러리 바로가기
IronXL API 참조 문서
편리한 IronXL API 참조 문서를 사용하여 Excel 스프레드시트에서 셀을 병합, 병합 해제 및 작업하는 방법에 대해 자세히 알아보고 공유하세요.
IronXL을 사용하면 CreateChart() 메서드를 호출하고, AddSeries() 메서드로 데이터 계열을 추가하고, 제목과 범례를 구성한 다음, Plot() 메서드로 그래프를 그려 C#에서 Excel 차트를 생성할 수 있습니다. 이 모든 과정을 단 5줄의 코드로 완료할 수 있습니다.
엑셀에서 프로그램으로 만들 수 있는 차트 유형에는 어떤 것들이 있나요?
IronXL은 C# 애플리케이션에서 막대형 차트, 선형 차트, 원형 차트, 영역형 차트 및 산점도 차트를 포함한 다양한 차트 유형을 프로그래밍 방식으로 생성할 수 있도록 지원합니다.
C#에서 Excel 차트를 생성하는 라이브러리를 어떻게 설치하나요?
Visual Studio의 NuGet 패키지 관리자를 사용하여 IronXL을 설치하려면 프로젝트 메뉴 > NuGet 패키지 관리 > IronXL.Excel 검색 > 설치를 선택하십시오. 이렇게 하면 Excel 차트를 프로그래밍 방식으로 생성하는 데 필요한 모든 도구가 제공됩니다.
프로그램으로 생성한 엑셀 차트에 제목과 범례를 추가할 수 있나요?
네, IronXL에서는 SetTitle() 메서드를 사용하여 차트 제목을 설정하고 SetLegendPosition() 메서드를 사용하여 범례 위치를 구성할 수 있으므로 차트의 모양과 레이아웃을 완벽하게 제어할 수 있습니다.
엑셀 차트 생성에 지원되는 파일 형식은 무엇인가요?
IronXL은 XLS, XLSX, CSV, TSV를 포함한 다양한 Excel 파일 형식을 지원하므로 프로그램 방식으로 차트를 생성할 때 최신 Excel 파일과 기존 Excel 파일 모두를 사용할 수 있습니다.
기존 엑셀 데이터를 이용해서 차트를 만들 수 있나요, 아니면 새 스프레드시트를 만들어야 하나요?
IronXL은 기존 스프레드시트를 불러오거나 처음부터 프로그래밍 방식으로 생성할 수 있어 Excel 차트를 생성할 때 새로운 프로젝트와 기존 시스템 통합 모두에 적합합니다.
C#에서 Excel 차트를 만드는 기본적인 워크플로는 무엇인가요?
IronXL을 사용한 최소 워크플로는 다음 6단계로 구성됩니다. Excel 라이브러리 설치, Excel 파일을 Workbook 객체로 불러오기, CreateChart를 사용하여 차트 생성, 차트 제목 및 범례 설정, Plot 메서드 호출, 그리고 Workbook을 Excel 파일로 저장.
엑셀 차트에 데이터 계열을 추가하려면 어떻게 해야 하나요?
IronXL의 AddSeries() 메서드를 사용하여 차트에 데이터 계열을 추가할 수 있습니다. 예를 들어 chart.AddSeries("A2:A7", "B2:B7")와 같이 데이터가 들어갈 셀 범위를 지정하면 해당 범위의 값으로 계열이 추가됩니다.
How can I customize chart appearance in IronXL?
IronXL provides extensive customization options for charts, including modifying colors, adding data labels, adjusting axis scales, and applying different formatting styles. This allows you to create visually appealing and informative Excel charts.
What is the advantage of using the IronXL library for Excel chart creation?
IronXL simplifies the process of creating and managing Excel charts programmatically in C#. It handles complex Excel XML formatting, supports various chart types, offers extensive customization, and provides efficient memory management for large files, allowing developers to focus on business logic.
커티스 차우는 칼턴 대학교에서 컴퓨터 과학 학사 학위를 취득했으며, Node.js, TypeScript, JavaScript, React를 전문으로 하는 프론트엔드 개발자입니다. 직관적이고 미적으로 뛰어난 사용자 인터페이스를 만드는 데 열정을 가진 그는 최신 프레임워크를 활용하고, 잘 구성되고 시각적으로 매력적인 매뉴얼을 제작하는 것을 즐깁니다.