


How to Use C# to Create Excel Charts
Create Excel charts in C# using IronXL by calling CreateChart() method, adding data series with AddSeries(), configuring title and legend, then plotting with Plot() method - complete Excel visualization in just a few lines of code.
Quickstart: Programmatically Generate an Excel Chart in C#
Create a column chart in IronXL: use a single worksheet method to create the chart, add a data series, set title and legend, plot it, and save. For a comprehensive overview of IronXL's capabilities, visit our Get Started Overview page.
-
Install IronXL with NuGet Package Manager
-
Copy and run this code snippet.
IChart chart = worksheet.CreateChart(ChartType.Column, 5, 5, 20, 10); chart.AddSeries("A2:A7", "B2:B7"); chart.SetTitle("Sales Overview").SetLegendPosition(LegendPosition.Bottom).Plot(); workbook.SaveAs("SalesChart.xlsx"); -
Deploy to test on your live environment
Start using IronXL in your project today with a free trial

Minimal Workflow (6 steps)
- Install Excel library to create Excel charts.
- Load the existing Excel file into a
Workbookobject. - Create a chart with
CreateChart. - Set the chart's title and legend.
- Call the
Plotmethod. - Save the
Workbookto the Excel file.
Programmatically Create Excel Charts in .NET
- Create Excel graphs programmatically
- Add series with title and legend

Step 1
How Do I Install IronXL for Excel Chart Creation?
Install IronXL using the NuGet Package Manager in Visual Studio:
- Select the Project menu
- Manage NuGet Packages
- Search for
IronXL.Excel - Install
This installation provides all tools needed to create Excel charts programmatically. IronXL supports various chart types including column, line, pie, bar, area, and scatter charts.
Why Should I Use NuGet Package Manager?
You can also enter the following command into the Developer Command Prompt:
Install-Package IronXL.Excel
What Are Alternative Installation Methods?
Or download from here: https://ironsoftware.com/csharp/excel/packages/IronXL.zip
Once installed, IronXL allows you to create new Excel files from scratch or work with existing spreadsheets, suitable for both new projects and legacy system integration.
How to Tutorial
How Do I Create Excel Charts Programmatically in .NET?
Add the following data into an Excel Spreadsheet:
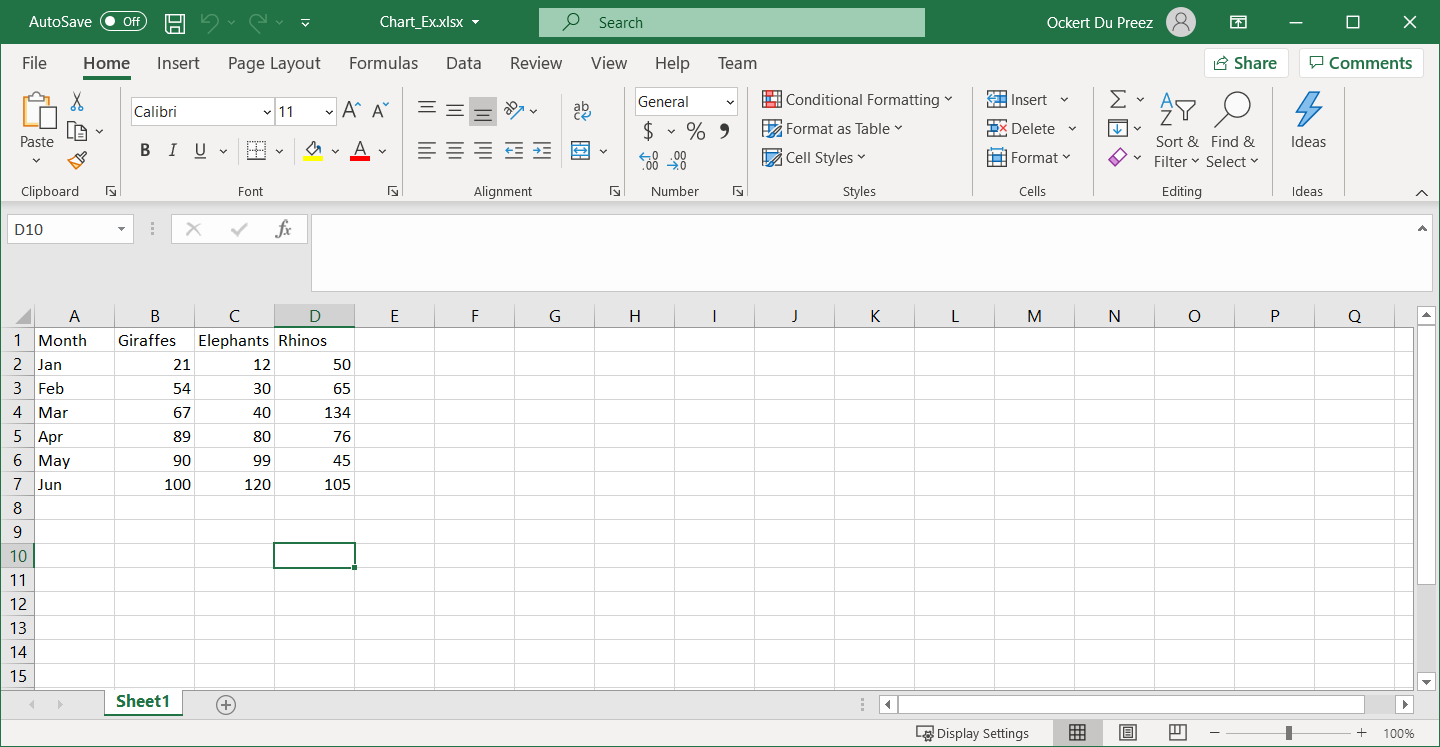
Figure 1 – Data to be used for charting
Before creating charts, ensure your data is properly organized. IronXL can load existing spreadsheets or you can create them programmatically. The library supports various Excel file formats including XLS, XLSX, CSV, and TSV.
What Namespaces Are Required for Excel Charts?
Add the namespaces necessary to work with Excel charts in IronXL:
:path=/static-assets/excel/content-code-examples/how-to/csharp-create-excel-chart-programmatically-3.csusing IronXL;
using IronXL.Drawing.Charts;
Imports IronXL
Imports IronXL.Drawing.ChartsThese namespaces provide access to all chart-related functionality. The IronXL namespace contains core workbook and worksheet operations, while IronXL.Drawing.Charts handles chart creation and customization features.
How Do I Add Multiple Data Series to My Chart?
Add code to create the Excel graph programmatically with IronXL:
:path=/static-assets/excel/content-code-examples/how-to/csharp-create-excel-chart-programmatically-example.csusing IronXL;
using IronXL.Drawing.Charts;
// Load the existing Excel workbook
WorkBook wb = WorkBook.Load("Chart_Ex.xlsx");
// Use the default worksheet from the workbook
WorkSheet ws = wb.DefaultWorkSheet;
// Create a column chart at the specified range of cells
var chart = ws.CreateChart(ChartType.Column, 10, 15, 25, 20);
// Define the range for the x-axis data
const string xAxis = "A2:A7";
// Add a series for the chart using data in the range and give it a title from the first row
var series = chart.AddSeries(xAxis, "B2:B7");
series.Title = ws["B1"].StringValue;
// Add another series
series = chart.AddSeries(xAxis, "C2:C7");
series.Title = ws["C1"].StringValue;
// Add a third series
series = chart.AddSeries(xAxis, "D2:D7");
series.Title = ws["D1"].StringValue;
// Set the chart title
chart.SetTitle("Column Chart");
// Position the legend at the bottom of the chart
chart.SetLegendPosition(LegendPosition.Bottom);
// Plot the chart with the provided data
chart.Plot();
// Save the workbook with the newly added chart
wb.SaveAs("Exported_Column_Chart.xlsx");Imports IronXL
Imports IronXL.Drawing.Charts
' Load the existing Excel workbook
Dim wb As WorkBook = WorkBook.Load("Chart_Ex.xlsx")
' Use the default worksheet from the workbook
Dim ws As WorkSheet = wb.DefaultWorkSheet
' Create a column chart at the specified range of cells
Dim chart = ws.CreateChart(ChartType.Column, 10, 15, 25, 20)
' Define the range for the x-axis data
Const xAxis As String = "A2:A7"
' Add a series for the chart using data in the range and give it a title from the first row
Dim series = chart.AddSeries(xAxis, "B2:B7")
series.Title = ws("B1").StringValue
' Add another series
series = chart.AddSeries(xAxis, "C2:C7")
series.Title = ws("C1").StringValue
' Add a third series
series = chart.AddSeries(xAxis, "D2:D7")
series.Title = ws("D1").StringValue
' Set the chart title
chart.SetTitle("Column Chart")
' Position the legend at the bottom of the chart
chart.SetLegendPosition(LegendPosition.Bottom)
' Plot the chart with the provided data
chart.Plot()
' Save the workbook with the newly added chart
wb.SaveAs("Exported_Column_Chart.xlsx")The CreateChart method takes parameters for chart type and position (left column, top row, right column, bottom row). This positioning uses cell coordinates to precisely place your chart within the worksheet. You can create multiple charts on a single worksheet or spread them across different sheets.
When working with data series, IronXL allows you to reference cell ranges using standard Excel notation. This makes it intuitive for developers familiar with Excel to transition to programmatic chart creation. Additionally, you can combine charts with Excel formulas to create dynamic visualizations that update automatically when data changes.
How Can I Create Different Chart Types?
IronXL supports various chart types beyond column charts. Here's an example of creating a line chart with custom styling:
// Create a line chart for trend analysis
var lineChart = ws.CreateChart(ChartType.Line, 10, 22, 25, 32);

// Add data series with smooth lines
var trendSeries = lineChart.AddSeries("A2:A7", "B2:B7");
trendSeries.Title = "Q1 Sales Trend";

// Customize chart appearance
lineChart.SetTitle("Quarterly Sales Trend Analysis");
lineChart.SetLegendPosition(LegendPosition.Right);

// You can also create a column chart with multiple series
var comboChart = ws.CreateChart(ChartType.Column, 27, 15, 42, 25);
comboChart.AddSeries("A2:A7", "B2:B7"); // First column series
comboChart.AddSeries("A2:A7", "C2:C7"); // Second column series

comboChart.Plot();
// Create a line chart for trend analysis
var lineChart = ws.CreateChart(ChartType.Line, 10, 22, 25, 32);
// Add data series with smooth lines
var trendSeries = lineChart.AddSeries("A2:A7", "B2:B7");
trendSeries.Title = "Q1 Sales Trend";
// Customize chart appearance
lineChart.SetTitle("Quarterly Sales Trend Analysis");
lineChart.SetLegendPosition(LegendPosition.Right);
// You can also create a column chart with multiple series
var comboChart = ws.CreateChart(ChartType.Column, 27, 15, 42, 25);
comboChart.AddSeries("A2:A7", "B2:B7"); // First column series
comboChart.AddSeries("A2:A7", "C2:C7"); // Second column series
comboChart.Plot();' Create a line chart for trend analysis
Dim lineChart = ws.CreateChart(ChartType.Line, 10, 22, 25, 32)
' Add data series with smooth lines
Dim trendSeries = lineChart.AddSeries("A2:A7", "B2:B7")
trendSeries.Title = "Q1 Sales Trend"
' Customize chart appearance
lineChart.SetTitle("Quarterly Sales Trend Analysis")
lineChart.SetLegendPosition(LegendPosition.Right)
' You can also create a column chart with multiple series
Dim comboChart = ws.CreateChart(ChartType.Column, 27, 15, 42, 25)
comboChart.AddSeries("A2:A7", "B2:B7") ' First column series
comboChart.AddSeries("A2:A7", "C2:C7") ' Second column series
comboChart.Plot()What Does the Final Chart Output Look Like?
A Workbook object and a Worksheet object are created. The CreateChart method of the Worksheet object gets called to specify the chart type and chart location. The chart's series get added with title and legend.
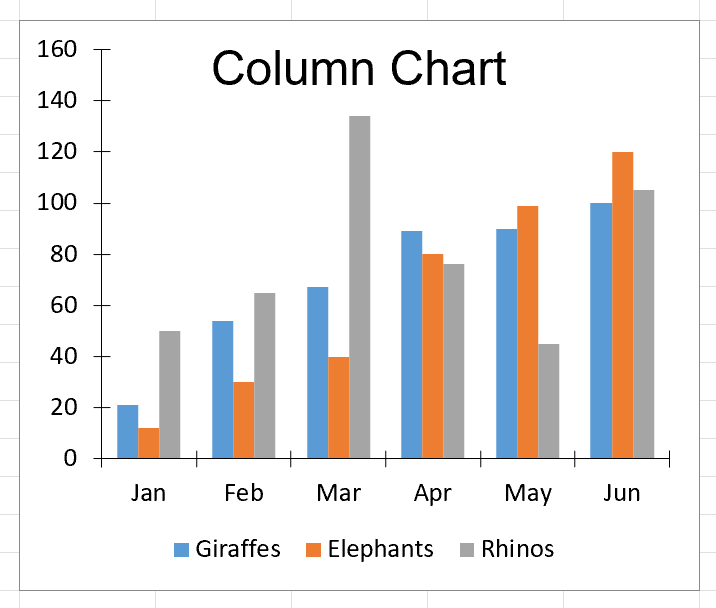
Figure 2 – Chart output
The resulting chart provides a clear visual representation of your data. IronXL handles all complex Excel XML formatting behind the scenes, allowing you to focus on your business logic. For more examples of chart creation, check our Excel chart examples page.
Advanced Chart Customization
Beyond basic chart creation, IronXL offers extensive customization options. You can modify colors, add data labels, adjust axis scales, and apply various formatting options. The library's Save & Export features ensure your charts are preserved correctly across different Excel formats and versions.
When working with large datasets, consider implementing pagination or data filtering before chart creation. This approach ensures optimal performance and prevents cluttered visualizations. IronXL's efficient memory management allows you to work with substantial Excel files without performance degradation.
Library Quick Access
IronXL API Reference Documentation
Learn more and share how to merge, unmerge, and work with cells in Excel spreadsheets using the handy [IronXL API Reference Documentation](https://ironsoftware.com/csharp/excel/object-reference/api/).
IronXL API Reference Documentation
Frequently Asked Questions
How do I create an Excel chart programmatically in C#?
You can create Excel charts in C# using IronXL by calling the CreateChart() method, adding data series with AddSeries(), configuring title and legend, and then plotting with the Plot() method. The entire process can be completed in just 5 lines of code.
What chart types can I create programmatically in Excel?
IronXL supports creating various chart types including column charts, line charts, pie charts, bar charts, area charts, and scatter charts programmatically in your C# applications.
How do I install a library for creating Excel charts in C#?
Install IronXL using the NuGet Package Manager in Visual Studio by selecting Project menu > Manage NuGet Packages > Search for IronXL.Excel > Install. This provides all tools needed to create Excel charts programmatically.
Can I add titles and legends to my programmatically created Excel charts?
Yes, IronXL allows you to set chart titles using the SetTitle() method and configure legend positions with SetLegendPosition() method, giving you full control over your chart's appearance and layout.
What file formats are supported for Excel chart creation?
IronXL supports various Excel file formats including XLS, XLSX, CSV, and TSV, allowing you to work with both modern and legacy Excel files when creating charts programmatically.
Can I create charts from existing Excel data or do I need to create new spreadsheets?
IronXL allows you to both load existing spreadsheets and create them programmatically from scratch, making it suitable for both new projects and legacy system integration when generating Excel charts.
What is the basic workflow for creating an Excel chart in C#?
The minimal workflow with IronXL consists of 6 steps: Install the Excel library, load the Excel file into a Workbook object, create a chart with CreateChart, set the chart's title and legend, call the Plot method, and save the Workbook to the Excel file.
How do I add data series to my Excel chart?
Use the AddSeries() method in IronXL to add data series to your chart by specifying the cell ranges for your data, such as chart.AddSeries("A2:A7", "B2:B7") to add a series with values from these ranges.


Still Scrolling?
Want proof fast? PM > Install-Package IronXL.Excel
run a sample watch your data become a spreadsheet.


