如何使用C#來建立Excel圖表

在C#中使用IronXL建立Excel圖表,通過調用Plot()方法繪圖 - 5行程式碼即可完成Excel可視化。
快速入門:使用C#程式碼生成Excel圖表
在IronXL中建立柱形圖:使用單一工作表方法建立圖表,新增資料系列,設置標題和圖例,繪製並保存。 要了解IronXL功能的全面概覽,請存取我們的快速入門概覽頁。
-
1Install IronXL with NuGet Package Manager
-
2複製並運行這段程式碼片段。
IChart chart = worksheet.CreateChart(ChartType.Column, 5, 5, 20, 10); chart.AddSeries("A2:A7", "B2:B7"); chart.SetTitle("Sales Overview").SetLegendPosition(LegendPosition.Bottom).Plot(); workbook.SaveAs("SalesChart.xlsx");C# -
3部署以在您的實時環境中測試
今天就開始在您的專案中使用IronXL,透過免費試用
最少工作流程(6步驟)
- 安裝Excel程式庫以建立Excel圖表。
- 將現有的Excel文件載入到
Workbook物件。 - 使用
CreateChart建立圖表。 - 設置圖表的標題和圖例。
- 調用
Plot方法。 - 保存
Workbook到Excel文件。
以程式化的方式建立.NET中的Excel圖表
- 以程式化的方式建立Excel圖形
- 新增帶有標題和圖例的系列
步驟 1
如何安裝IronXL來建立Excel圖表?
在Visual Studio中使用NuGet套件管理器安裝IronXL:
- 選擇專案選單
- 管理NuGet套件
- 搜索
IronXL.Excel - 安裝
此安裝提供了所有工具,所需程式化地建立Excel圖表。 IronXL支持各種圖表型別,包括柱狀圖、折線圖、餅圖、條形圖、面積圖和散點圖。
為什麼我應該使用NuGet套件管理器?
您也可以在開發者命令提示符下輸入以下命令:
有什麼替代安裝方法?
Or download from here: https://ironsoftware.com/csharp/excel/packages/IronXL.zip
安裝後,IronXL允許您從頭建立新的Excel文件或處理現有的電子表格,適合新專案和遺留系統整合。
教程
如何在.NET中程式化地建立Excel圖表?
將以下資料新增到Excel電子表格:
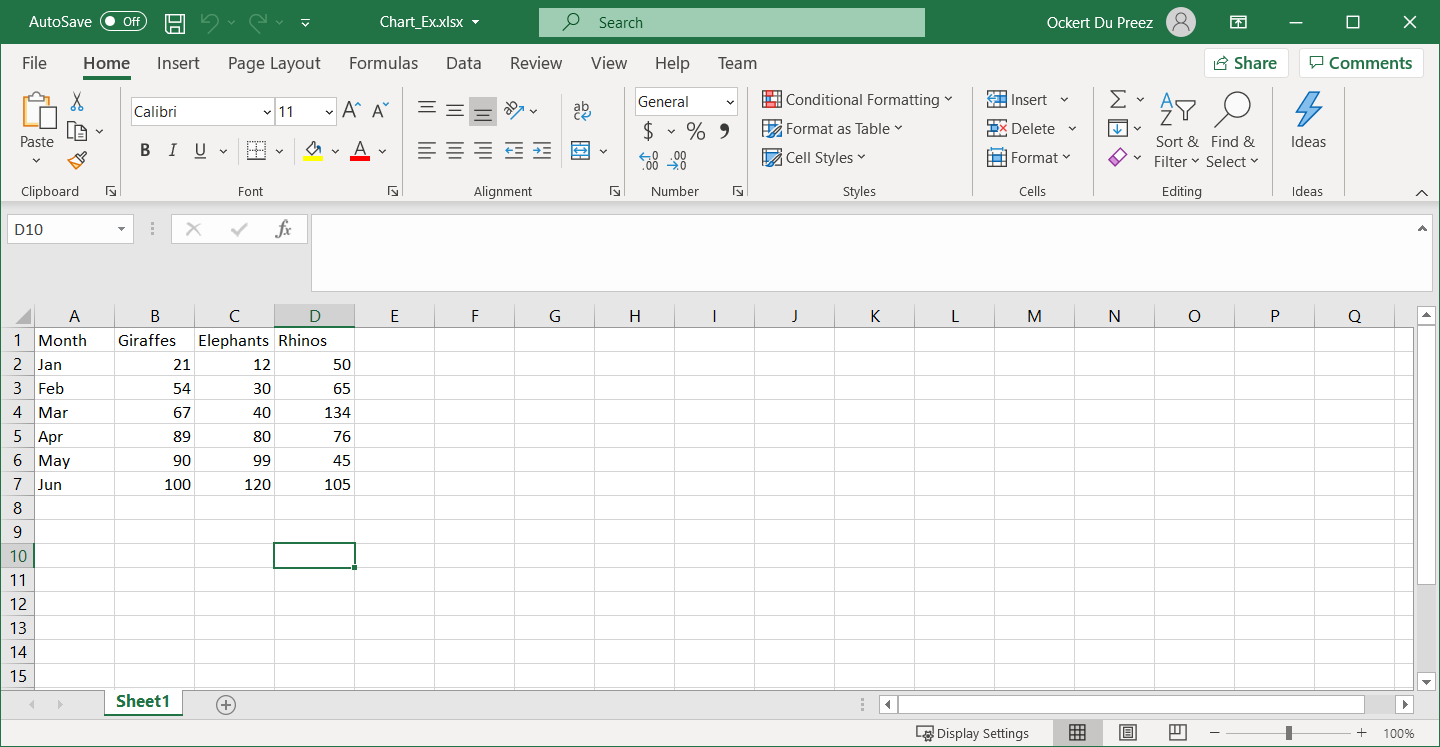
圖1 – 用於繪圖的資料
在建立圖表之前,請確保您的資料排列正確。 IronXL可以載入現有的電子表格,或者您可以程式化地建立它們。 程式庫支持各種Excel文件格式,包括XLS、XLSX、CSV和TSV。
建立Excel圖表需要哪些命名空間?
新增IronXL處理Excel圖表所需的命名空間:
using IronXL;
using IronXL.Drawing.Charts;Imports IronXL
Imports IronXL.Drawing.Charts這些命名空間提供對所有圖表相關功能的存取權限。 IronXL.Drawing.Charts負責圖表建立和自定義功能。
如何將多個資料系列新增到我的圖表?
新增程式碼以使用IronXL程式化建立Excel圖形:
using IronXL;
using IronXL.Drawing.Charts;
// Load the existing Excel workbook
WorkBook wb = WorkBook.Load("Chart_Ex.xlsx");
// Use the default worksheet from the workbook
WorkSheet ws = wb.DefaultWorkSheet;
// Create a column chart at the specified range of cells
var chart = ws.CreateChart(ChartType.Column, 10, 15, 25, 20);
// Define the range for the x-axis data
const string xAxis = "A2:A7";
// Add a series for the chart using data in the range and give it a title from the first row
var series = chart.AddSeries(xAxis, "B2:B7");
series.Title = ws["B1"].StringValue;
// Add another series
series = chart.AddSeries(xAxis, "C2:C7");
series.Title = ws["C1"].StringValue;
// Add a third series
series = chart.AddSeries(xAxis, "D2:D7");
series.Title = ws["D1"].StringValue;
// Set the chart title
chart.SetTitle("Column Chart");
// Position the legend at the bottom of the chart
chart.SetLegendPosition(LegendPosition.Bottom);
// Plot the chart with the provided data
chart.Plot();
// Save the workbook with the newly added chart
wb.SaveAs("Exported_Column_Chart.xlsx");Imports IronXL
Imports IronXL.Drawing.Charts
' Load the existing Excel workbook
Dim wb As WorkBook = WorkBook.Load("Chart_Ex.xlsx")
' Use the default worksheet from the workbook
Dim ws As WorkSheet = wb.DefaultWorkSheet
' Create a column chart at the specified range of cells
Dim chart = ws.CreateChart(ChartType.Column, 10, 15, 25, 20)
' Define the range for the x-axis data
Const xAxis As String = "A2:A7"
' Add a series for the chart using data in the range and give it a title from the first row
Dim series = chart.AddSeries(xAxis, "B2:B7")
series.Title = ws("B1").StringValue
' Add another series
series = chart.AddSeries(xAxis, "C2:C7")
series.Title = ws("C1").StringValue
' Add a third series
series = chart.AddSeries(xAxis, "D2:D7")
series.Title = ws("D1").StringValue
' Set the chart title
chart.SetTitle("Column Chart")
' Position the legend at the bottom of the chart
chart.SetLegendPosition(LegendPosition.Bottom)
' Plot the chart with the provided data
chart.Plot()
' Save the workbook with the newly added chart
wb.SaveAs("Exported_Column_Chart.xlsx")CreateChart方法接受圖表型別和位置(左列、頂行、右列、底行)的參數。 此定位使用單元格坐標精確地將圖表放置在工作表內。 您可以在單個工作表上建立多個圖表,或者將它們分佈在不同的工作表上。
在處理資料系列時,IronXL允許您使用標準Excel符號來引用單元格範圍。 這使熟悉Excel的開發人員能夠直觀地轉換到程式化圖表建立。 此外,您可以將圖表與Excel公式結合起來,建立動態可視化,當資料更改時自動更新。
如何建立不同型別的圖表?
IronXL支持柱狀圖以外的各種圖表型別。 以下是建立帶有自定義樣式的折線圖的範例:
// Create a line chart for trend analysis
var lineChart = ws.CreateChart(ChartType.Line, 10, 22, 25, 32);

// Add data series with smooth lines
var trendSeries = lineChart.AddSeries("A2:A7", "B2:B7");
trendSeries.Title = "Q1 Sales Trend";

// Customize chart appearance
lineChart.SetTitle("Quarterly Sales Trend Analysis");
lineChart.SetLegendPosition(LegendPosition.Right);

// You can also create combination charts
var comboChart = ws.CreateChart(ChartType.ColumnClustered, 27, 15, 42, 25);
comboChart.AddSeries("A2:A7", "B2:B7"); // Column series
comboChart.AddSeries("A2:A7", "C2:C7"); // Can be styled as line

comboChart.Plot();' Create a line chart for trend analysis
Dim lineChart = ws.CreateChart(ChartType.Line, 10, 22, 25, 32)
' Add data series with smooth lines
Dim trendSeries = lineChart.AddSeries("A2:A7", "B2:B7")
trendSeries.Title = "Q1 Sales Trend"
' Customize chart appearance
lineChart.SetTitle("Quarterly Sales Trend Analysis")
lineChart.SetLegendPosition(LegendPosition.Right)
' You can also create combination charts
Dim comboChart = ws.CreateChart(ChartType.ColumnClustered, 27, 15, 42, 25)
comboChart.AddSeries("A2:A7", "B2:B7") ' Column series
comboChart.AddSeries("A2:A7", "C2:C7") ' Can be styled as line
comboChart.Plot()最終的圖表輸出是什麼樣的?
建立了Worksheet物件。 CreateChart方法被調用來指定圖表型別和圖表位置。 圖表的系列被新增,並配有標題和圖例。
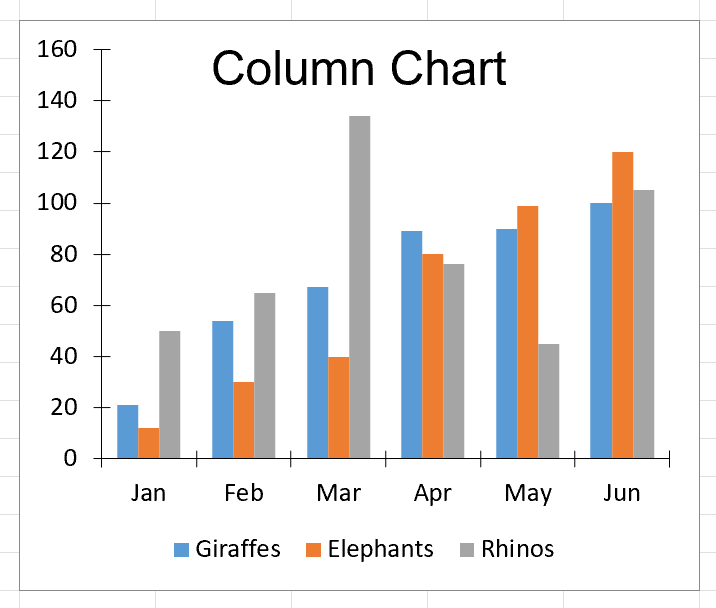
圖2 – 圖表輸出
生成的圖表提供了資料的清晰可視化表示。 IronXL在幕後處理所有複雜的Excel XML格式,讓您專注於業務邏輯。 有關更多圖表建立範例,請查看我們的Excel圖表範例頁面。
高級圖表自定義
除了基本的圖表建立,IronXL還提供了廣泛的自定義選項。 您可以修改顏色,新增資料標籤,調整軸比例並應用各種格式選項。 程式庫的保存和導出功能確保您的圖表在不同的Excel格式和版本中正確保留。
在處理大型資料集時,建議在建立圖表之前實施分頁或資料過濾。 此方法可確保最佳性能並防止視覺效果雜亂。 IronXL的高效記憶體管理使您能夠處理大量的Excel文件而不會性能下降。
程式庫快捷存取
IronXL API參考文件
Learn more and share how to merge, unmerge, and work with cells in Excel spreadsheets using the handy IronXL API參考文件.
IronXL API參考文件
常見問題
我如何在 C# 中程式化建立 Excel 圖表?
您可以使用 IronXL 在 C# 中建立 Excel 圖表,只需呼叫 CreateChart() 方法,使用 AddSeries() 新增資料系列,配置標題和圖例,然後使用 Plot() 方法繪製圖表。整個過程僅需 5 行程式碼即可完成。
我可以在 Excel 中程式化建立哪些型別的圖表?
IronXL 支持生成各種圖表型別,包括柱狀圖、折線圖、圓餅圖、條形圖、面積圖和散佈圖,供您在 C# 應用程式中使用。
我如何安裝用於在 C# 中建立 Excel 圖表的程式庫?
在 Visual Studio 中使用 NuGet 套件管理器安裝 IronXL,選擇專案選單 > 管理 NuGet 套件 > 搜尋 IronXL.Excel > 安裝。這為您提供了所有需要的工具來程式化建立 Excel 圖表。
我可以為程式化建立的 Excel 圖表新增標題和圖例嗎?
是的,IronXL 允許您使用 SetTitle() 方法設置圖表標題,並使用 SetLegendPosition() 方法配置圖例位置,讓您完全控制圖表的外觀和佈局。
支持哪些文件格式進行 Excel 圖表的建立?
IronXL 支持多種 Excel 文件格式,包括 XLS、XLSX、CSV 和 TSV,使您能夠在建立圖表時使用現代和傳統的 Excel 文件。
我可以根據現有的 Excel 資料建立圖表,還是需要新建試算表?
IronXL 允許您載入現有的試算表或程式化地從頭建立它們,使其適合於新專案和遺留系統整合在生成 Excel 圖表時的需求。
using C# 建立 Excel 圖表的基本工作流程是什麼?
using IronXL 的基本工作流程包括 6 個步驟:安裝 Excel 程式庫,將 Excel 文件載入到一個 Workbook 物件中,使用 CreateChart 建立圖表,設置圖表的標題和圖例,呼叫 Plot 方法,然後將工作簿儲存到 Excel 文件中。
我如何將資料系列新增到我的 Excel 圖表中?
在 IronXL 中使用 AddSeries() 方法,通過指定資料的單元格範圍來向圖表中新增資料系列,例如 chart.AddSeries("A2:A7", "B2:B7") 新增一個含有這些範圍值的資料系列。
How can I customize chart appearance in IronXL?
IronXL provides extensive customization options for charts, including modifying colors, adding data labels, adjusting axis scales, and applying different formatting styles. This allows you to create visually appealing and informative Excel charts.
What is the advantage of using the IronXL library for Excel chart creation?
IronXL simplifies the process of creating and managing Excel charts programmatically in C#. It handles complex Excel XML formatting, supports various chart types, offers extensive customization, and provides efficient memory management for large files, allowing developers to focus on business logic.

Curtis Chau擁有Carleton大學的電腦科學學士學位,專精於前端開發,擁有Node.js、TypeScript、JavaScript和React的專業知識。Curtis熱衷於建立直觀且美觀的使用者介面,喜愛使用現代框架並建立結構良好、視覺吸引力的手冊。