Comment utiliser C# ; pour créer des graphiques Excel
Le mode d'emploi suivant vous permet de créer un graphique Excel par programmation en C# à l'aide d'IronXL.
Créer par programme des graphiques Excel dans .NET

How to Create Excel Chart in C#
Installer la bibliothèque Excel pour créer des graphiques Excel.
Chargez le fichier Excel existant dans un objet
Workbook.Créez un graphique avec
CreateChart.Définir le titre et la légende du graphique
Appelez la méthode
Plot.- Enregistrez le
Workbookdans le fichier Excel.Étape 1
1. Installer IronXL
Tout d'abord, la manière la plus simple d'installer IronXL est d'utiliser le gestionnaire de paquets NuGet dans Visual Studio :
- Sélectionnez le menu Projet
- Gérer les paquets NuGet
- Recherche d'IronXL.Excel
Installer
Vous pouvez également saisir la commande suivante dans l'invite de commande du développeur :
Install-Package IronXL.Excel
Ou téléchargez à partir d'ici : https://ironsoftware.com/csharp/excel/packages/IronXL.zip
Comment faire Tutoriel
2. Créer un graphique Excel pour .NET
Maintenant, pour le projet !
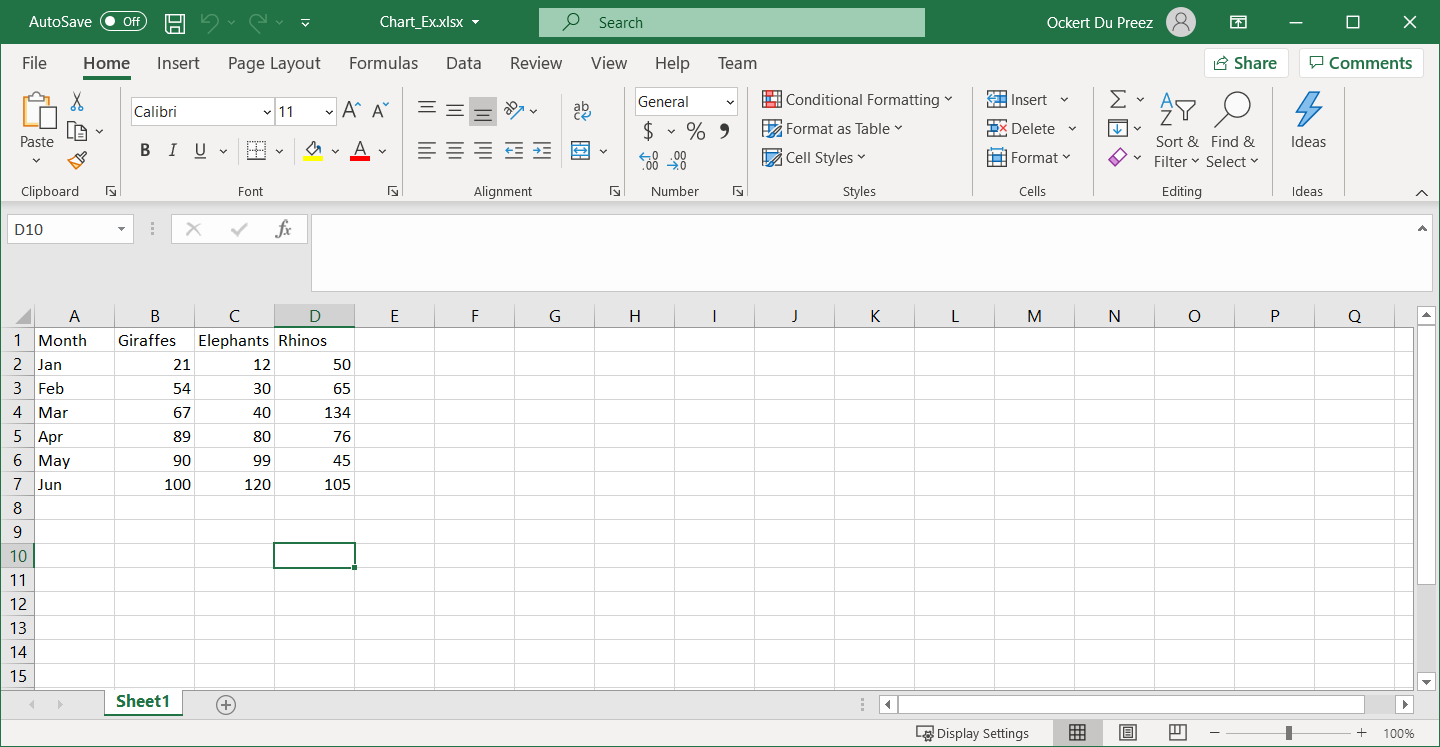
Ajoutez les informations suivantes dans une feuille de calcul Excel. Ceci est illustré ci-dessous :
Ajouter les espaces de nommage nécessaires pour travailler avec des graphiques Excel dans IronXL.
using IronXL;
using IronXL.Drawing.Charts;
using IronXL;
using IronXL.Drawing.Charts;Imports IronXL
Imports IronXL.Drawing.ChartsAjoutez du code pour créer le graphique Excel par programmation avec IronXL :
private void button1_Click(object sender, EventArgs e)
{
    WorkBook wb = WorkBook.Load("Chart_Ex.xlsx");
    WorkSheet ws = wb.DefaultWorkSheet;

    var chart = ws.CreateChart(ChartType.Column, 10, 15, 25, 20);

    const string xAxis = "A2:A7";

    var series = chart.AddSeries(xAxis, "B2:B7");
    series.Title = ws ["B1"].StringValue;

    series = chart.AddSeries(xAxis, "C2:C7");
    series.Title = ws ["C1"].StringValue;

    series = chart.AddSeries(xAxis, "D2:D7");
    series.Title = ws ["D1"].StringValue;

    chart.SetTitle("Column Chart");
    chart.SetLegendPosition(LegendPosition.Bottom);
    chart.Plot();
    wb.SaveAs("Exported_Column_Chart.xlsx");
}
private void button1_Click(object sender, EventArgs e)
{
WorkBook wb = WorkBook.Load("Chart_Ex.xlsx");
WorkSheet ws = wb.DefaultWorkSheet;
var chart = ws.CreateChart(ChartType.Column, 10, 15, 25, 20);
const string xAxis = "A2:A7";
var series = chart.AddSeries(xAxis, "B2:B7");
series.Title = ws ["B1"].StringValue;
series = chart.AddSeries(xAxis, "C2:C7");
series.Title = ws ["C1"].StringValue;
series = chart.AddSeries(xAxis, "D2:D7");
series.Title = ws ["D1"].StringValue;
chart.SetTitle("Column Chart");
chart.SetLegendPosition(LegendPosition.Bottom);
chart.Plot();
wb.SaveAs("Exported_Column_Chart.xlsx");
}Private Sub button1_Click(ByVal sender As Object, ByVal e As EventArgs)
Dim wb As WorkBook = WorkBook.Load("Chart_Ex.xlsx")
Dim ws As WorkSheet = wb.DefaultWorkSheet
Dim chart = ws.CreateChart(ChartType.Column, 10, 15, 25, 20)
Const xAxis As String = "A2:A7"
Dim series = chart.AddSeries(xAxis, "B2:B7")
series.Title = ws ("B1").StringValue
series = chart.AddSeries(xAxis, "C2:C7")
series.Title = ws ("C1").StringValue
series = chart.AddSeries(xAxis, "D2:D7")
series.Title = ws ("D1").StringValue
chart.SetTitle("Column Chart")
chart.SetLegendPosition(LegendPosition.Bottom)
chart.Plot()
wb.SaveAs("Exported_Column_Chart.xlsx")
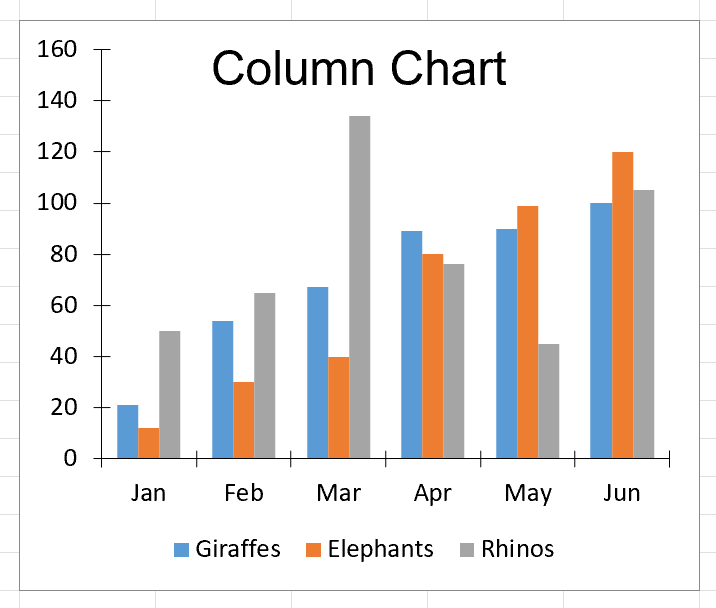
End SubUn objet Classeur et un objet Feuille de calcul sont créés. La méthode CreateChart de l'objet Worksheet est appelée pour spécifier le type de graphique et l'emplacement du graphique. La série du graphique est ajoutée, ainsi que son titre et sa légende. Ceci est illustré ci-dessous.

Figure 2 – Sortie du graphique
Accès rapide à la bibliothèque
Documentation de référence de l'API IronXL
Learn more and share how to merge, unmerge, and work with cells in Excel spreadsheets using the handy Documentation de référence de l'API IronXL.
Documentation de référence de l'API IronXL


