


Excel 차트를 만드는 방법 C
데이터 시리즈 추가, 제목 및 범례 구성, 그리고 Plot() 메서드를 사용하여 플로팅하여 5줄의 코드로 완전한 Excel 시각화를 통해서 IronXL을 사용하여 C#에서 @ CreateChart() 메서드를 호출하여 Excel 차트를 만들 수 있습니다.
시작하기: C#에서 프로그래밍 방식으로 Excel 차트 생성하기
IronXL에서 열 차트를 생성하세요: 단일 워크시트 메서드를 사용하여 차트를 만들고, 데이터 시리즈를 추가하고, 제목과 범례를 설정하고, 플롯한 다음 저장하세요. IronXL의 기능에 대한 종합적인 개요를 보려면 Get Started Overview 페이지를 방문하세요.
-
NuGet 패키지 관리자를 사용하여 https://www.nuget.org/packages/IronXL.Excel 설치하기
-
다음 코드 조각을 복사하여 실행하세요.
IChart chart = worksheet.CreateChart(ChartType.Column, 5, 5, 20, 10); chart.AddSeries("A2:A7", "B2:B7"); chart.SetTitle("Sales Overview").SetLegendPosition(LegendPosition.Bottom).Plot(); workbook.SaveAs("SalesChart.xlsx"); -
실제 운영 환경에서 테스트할 수 있도록 배포하세요.
무료 체험판으로 오늘 프로젝트에서 IronXL 사용 시작하기

최소 워크플로우 (6단계)
- Excel 차트를 만들 Excel 라이브러리를 설치하세요.
- 기존 Excel 파일을
Workbook객체로 로드합니다. CreateChart로 차트를 생성합니다.- 차트의 제목과 범례를 설정하세요.
Plot메서드를 호출합니다.- Excel 파일에
Workbook을 저장합니다.
프로그램 방식으로 .NET에서 Excel 차트 생성하기
- Excel 그래프를 프로그래밍 방식으로 생성하기
- 제목과 범례를 가진 시리즈 추가하기

1단계
IronXL을 설치하여 Excel 차트 생성하는 방법은?
Visual Studio의 NuGet 패키지 관리자를 사용하여 IronXL을 설치하세요:
- 프로젝트 메뉴 선택
- NuGet 패키지 관리
IronXL.Excel검색- 설치
이 설치는 프로그래밍 방식으로 Excel 차트를 생성하는 데 필요한 모든 도구를 제공합니다. IronXL은 열, 선, 원형, 막대, 영역 및 분산형 차트를 포함한 다양한 차트 유형을 지원합니다.
NuGet 패키지 관리자를 사용하는 이유는?
Developer Command Prompt에 다음 명령을 입력할 수도 있습니다:
Install-Package IronXL.Excel
다른 설치 방법은 무엇인가요?
또는 여기에서 다운로드하세요: https://ironsoftware.com/csharp/excel/packages/IronXL.zip
설치가 완료되면 IronXL을 사용하여 새로운 Excel 파일을 처음부터 생성하거나 기존 스프레드시트와 작업할 수 있으며, 이는 새로운 프로젝트와 기존 시스템 통합 모두에 적합합니다.
튜토리얼 사용법
.NET에서 프로그래밍 방식으로 Excel 차트를 생성하는 방법은?
Excel 스프레드시트에 다음 데이터를 추가하세요:
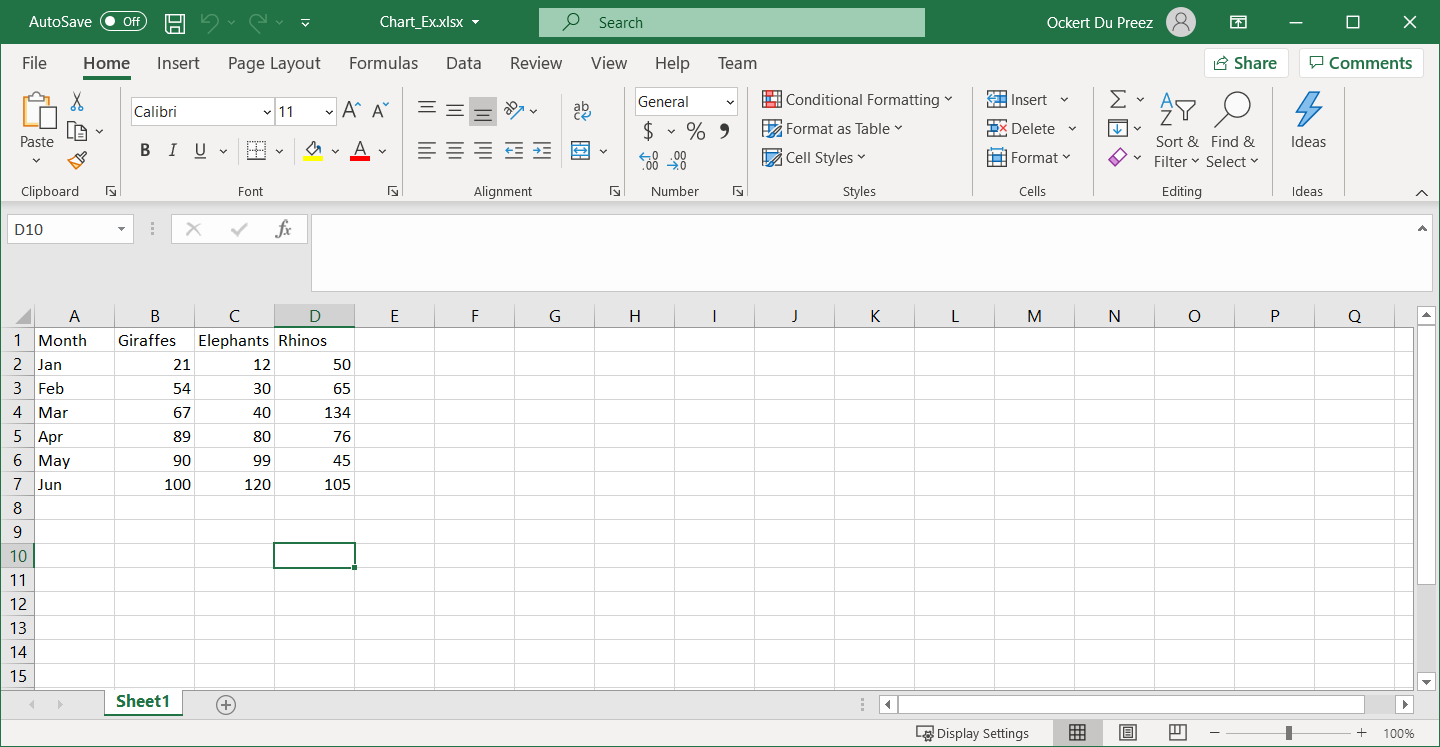
그림 1 – 차트 작성에 사용될 데이터
차트를 생성하기 전에 데이터가 적절히 정리되어 있는지 확인하세요. IronXL은 기존 스프레드시트를 로드할 수 있으며, 프로그램 방식으로 생성할 수도 있습니다. 이 라이브러리는 XLS, XLSX, CSV, TSV를 포함한 다양한 Excel 파일 형식을 지원합니다.
Excel 차트를 위해 필요한 네임스페이스는 무엇인가요?
IronXL에서 Excel 차트 작업에 필요한 네임스페이스를 추가하세요:
:path=/static-assets/excel/content-code-examples/how-to/csharp-create-excel-chart-programmatically-3.csusing IronXL;
using IronXL.Drawing.Charts;
Imports IronXL
Imports IronXL.Drawing.Charts이 네임스페이스는 모든 차트 관련 기능에 대한 액세스를 제공합니다. IronXL 네임스페이스는 핵심 워크북 및 워크시트 작업을 포함하며, IronXL.Drawing.Charts 는 차트 생성 및 사용자 정의 기능을 처리합니다.
내 차트에 여러 데이터 시리즈를 어떻게 추가하나요?
IronXL을 사용하여 Excel 그래프를 프로그래밍 방식으로 생성하는 코드를 추가하세요:
:path=/static-assets/excel/content-code-examples/how-to/csharp-create-excel-chart-programmatically-example.csusing IronXL;
using IronXL.Drawing.Charts;
// Load the existing Excel workbook
WorkBook wb = WorkBook.Load("Chart_Ex.xlsx");
// Use the default worksheet from the workbook
WorkSheet ws = wb.DefaultWorkSheet;
// Create a column chart at the specified range of cells
var chart = ws.CreateChart(ChartType.Column, 10, 15, 25, 20);
// Define the range for the x-axis data
const string xAxis = "A2:A7";
// Add a series for the chart using data in the range and give it a title from the first row
var series = chart.AddSeries(xAxis, "B2:B7");
series.Title = ws["B1"].StringValue;
// Add another series
series = chart.AddSeries(xAxis, "C2:C7");
series.Title = ws["C1"].StringValue;
// Add a third series
series = chart.AddSeries(xAxis, "D2:D7");
series.Title = ws["D1"].StringValue;
// Set the chart title
chart.SetTitle("Column Chart");
// Position the legend at the bottom of the chart
chart.SetLegendPosition(LegendPosition.Bottom);
// Plot the chart with the provided data
chart.Plot();
// Save the workbook with the newly added chart
wb.SaveAs("Exported_Column_Chart.xlsx");Imports IronXL
Imports IronXL.Drawing.Charts
' Load the existing Excel workbook
Dim wb As WorkBook = WorkBook.Load("Chart_Ex.xlsx")
' Use the default worksheet from the workbook
Dim ws As WorkSheet = wb.DefaultWorkSheet
' Create a column chart at the specified range of cells
Dim chart = ws.CreateChart(ChartType.Column, 10, 15, 25, 20)
' Define the range for the x-axis data
Const xAxis As String = "A2:A7"
' Add a series for the chart using data in the range and give it a title from the first row
Dim series = chart.AddSeries(xAxis, "B2:B7")
series.Title = ws("B1").StringValue
' Add another series
series = chart.AddSeries(xAxis, "C2:C7")
series.Title = ws("C1").StringValue
' Add a third series
series = chart.AddSeries(xAxis, "D2:D7")
series.Title = ws("D1").StringValue
' Set the chart title
chart.SetTitle("Column Chart")
' Position the legend at the bottom of the chart
chart.SetLegendPosition(LegendPosition.Bottom)
' Plot the chart with the provided data
chart.Plot()
' Save the workbook with the newly added chart
wb.SaveAs("Exported_Column_Chart.xlsx")CreateChart 메서드는 차트 유형과 위치(왼쪽 열, 위쪽 행, 오른쪽 열, 아래쪽 행)에 대한 매개변수를 받습니다. 이 위치 지정은 셀 좌표를 사용하여 워크시트 내에 차트를 정확하게 배치합니다. 단일 워크시트에 여러 차트를 생성하거나 다른 시트에 분산시킬 수 있습니다.
데이터 시리즈 작업 시 IronXL은 표준 Excel 표기법을 사용하여 셀 범위를 참조할 수 있습니다. 이로 인해 Excel에 익숙한 개발자가 프로그래밍 방식으로 차트를 생성하는 것이 직관적입니다. 또한, Excel 수식과 차트를 결합하여 데이터가 변경될 때 자동으로 업데이트되는 동적 시각화를 만들 수 있습니다.
다른 차트 유형을 어떻게 만들 수 있나요?
IronXL은 열 차트 외에도 다양한 차트 유형을 지원합니다. 다음은 사용자 정의 스타일을 사용하여 선 그래프를 생성하는 예입니다:
// Create a line chart for trend analysis
var lineChart = ws.CreateChart(ChartType.Line, 10, 22, 25, 32);

// Add data series with smooth lines
var trendSeries = lineChart.AddSeries("A2:A7", "B2:B7");
trendSeries.Title = "Q1 Sales Trend";

// Customize chart appearance
lineChart.SetTitle("Quarterly Sales Trend Analysis");
lineChart.SetLegendPosition(LegendPosition.Right);

// You can also create combination charts
var comboChart = ws.CreateChart(ChartType.ColumnClustered, 27, 15, 42, 25);
comboChart.AddSeries("A2:A7", "B2:B7"); // Column series
comboChart.AddSeries("A2:A7", "C2:C7"); // Can be styled as line

comboChart.Plot();
// Create a line chart for trend analysis
var lineChart = ws.CreateChart(ChartType.Line, 10, 22, 25, 32);
// Add data series with smooth lines
var trendSeries = lineChart.AddSeries("A2:A7", "B2:B7");
trendSeries.Title = "Q1 Sales Trend";
// Customize chart appearance
lineChart.SetTitle("Quarterly Sales Trend Analysis");
lineChart.SetLegendPosition(LegendPosition.Right);
// You can also create combination charts
var comboChart = ws.CreateChart(ChartType.ColumnClustered, 27, 15, 42, 25);
comboChart.AddSeries("A2:A7", "B2:B7"); // Column series
comboChart.AddSeries("A2:A7", "C2:C7"); // Can be styled as line
comboChart.Plot();' Create a line chart for trend analysis
Dim lineChart = ws.CreateChart(ChartType.Line, 10, 22, 25, 32)
' Add data series with smooth lines
Dim trendSeries = lineChart.AddSeries("A2:A7", "B2:B7")
trendSeries.Title = "Q1 Sales Trend"
' Customize chart appearance
lineChart.SetTitle("Quarterly Sales Trend Analysis")
lineChart.SetLegendPosition(LegendPosition.Right)
' You can also create combination charts
Dim comboChart = ws.CreateChart(ChartType.ColumnClustered, 27, 15, 42, 25)
comboChart.AddSeries("A2:A7", "B2:B7") ' Column series
comboChart.AddSeries("A2:A7", "C2:C7") ' Can be styled as line
comboChart.Plot()최종 차트 출력은 어떻게 생겼나요?
Workbook 객체 및 Worksheet 객체가 생성됩니다. CreateChart 메서드는 Worksheet 객체의 차트 유형 및 차트 위치 지정이 호출됩니다. 차트의 시리즈는 제목 및 범례와 함께 추가됩니다.
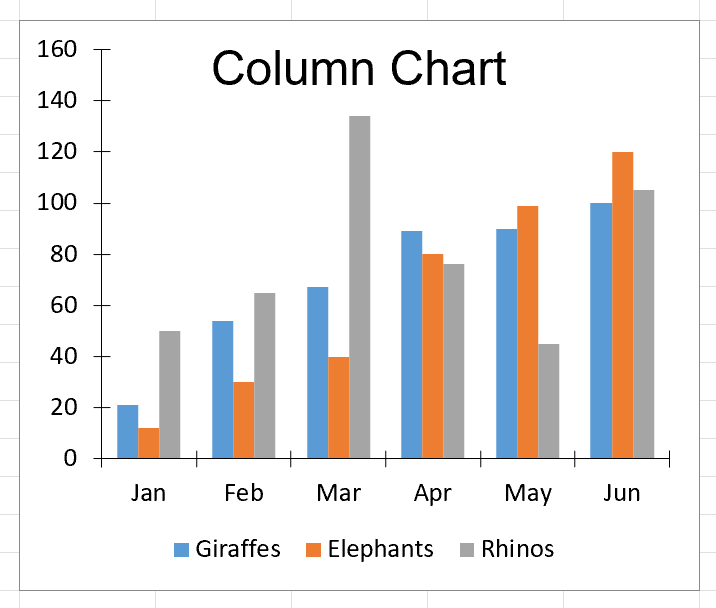
Figure 2 – 차트 출력
생성된 차트는 데이터의 명확한 시각적 표현을 제공합니다. IronXL은 모든 복잡한 Excel XML 형식화를 백그라운드에서 처리하여 비즈니스 로직에 집중할 수 있도록 해줍니다. 차트 작성에 대한 더 많은 예시는 Excel 차트 예제 페이지를 참조하세요.
고급 차트 사용자 정의
기본 차트 작성 외에도 IronXL은 광범위한 사용자 정의 옵션을 제공합니다. 색상을 수정하고, 데이터 레이블을 추가하며, 축 스케일을 조정하고 다양한 형식 옵션을 적용할 수 있습니다. 라이브러리의 저장 및 내보내기 기능은 차트가 다양한 Excel 형식 및 버전에서 올바르게 보존되도록 보장합니다.
대용량 데이터셋 작업 시 차트 작성 전에 페이지 매김 또는 데이터 필터링을 구현하는 것을 고려하세요. 이 방법은 최적의 성능을 보장하고 혼란스러운 시각화를 방지합니다. IronXL의 효율적인 메모리 관리를 통해 성능 저하 없이 대규모 Excel 파일을 다룰 수 있습니다.
라이브러리 바로가기
IronXL API 참조 문서
편리한 [IronXL API 참조 문서](https://ironsoftware.com/csharp/excel/object-reference/api/)를 사용하여 Excel 스프레드시트에서 셀을 병합, 병합 해제 및 작업하는 방법에 대해 자세히 알아보고 공유하세요.
IronXL API 참조 문서
자주 묻는 질문
C#에서 Excel 차트를 프로그래밍 방식으로 만드는 방법은 무엇인가요?
IronXL을 사용하면 CreateChart() 메서드를 호출하고, AddSeries() 메서드로 데이터 계열을 추가하고, 제목과 범례를 구성한 다음, Plot() 메서드로 그래프를 그려 C#에서 Excel 차트를 생성할 수 있습니다. 이 모든 과정을 단 5줄의 코드로 완료할 수 있습니다.
엑셀에서 프로그램으로 만들 수 있는 차트 유형에는 어떤 것들이 있나요?
IronXL은 C# 애플리케이션에서 막대형 차트, 선형 차트, 원형 차트, 영역형 차트 및 산점도 차트를 포함한 다양한 차트 유형을 프로그래밍 방식으로 생성할 수 있도록 지원합니다.
C#에서 Excel 차트를 생성하는 라이브러리를 어떻게 설치하나요?
Visual Studio의 NuGet 패키지 관리자를 사용하여 IronXL을 설치하려면 프로젝트 메뉴 > NuGet 패키지 관리 > IronXL.Excel 검색 > 설치를 선택하십시오. 이렇게 하면 Excel 차트를 프로그래밍 방식으로 생성하는 데 필요한 모든 도구가 제공됩니다.
프로그램으로 생성한 엑셀 차트에 제목과 범례를 추가할 수 있나요?
네, IronXL에서는 SetTitle() 메서드를 사용하여 차트 제목을 설정하고 SetLegendPosition() 메서드를 사용하여 범례 위치를 구성할 수 있으므로 차트의 모양과 레이아웃을 완벽하게 제어할 수 있습니다.
엑셀 차트 생성에 지원되는 파일 형식은 무엇인가요?
IronXL은 XLS, XLSX, CSV, TSV를 포함한 다양한 Excel 파일 형식을 지원하므로 프로그램 방식으로 차트를 생성할 때 최신 Excel 파일과 기존 Excel 파일 모두를 사용할 수 있습니다.
기존 엑셀 데이터를 이용해서 차트를 만들 수 있나요, 아니면 새 스프레드시트를 만들어야 하나요?
IronXL은 기존 스프레드시트를 불러오거나 처음부터 프로그래밍 방식으로 생성할 수 있어 Excel 차트를 생성할 때 새로운 프로젝트와 기존 시스템 통합 모두에 적합합니다.
C#에서 Excel 차트를 만드는 기본적인 워크플로는 무엇인가요?
IronXL을 사용한 최소 워크플로는 다음 6단계로 구성됩니다. Excel 라이브러리 설치, Excel 파일을 Workbook 객체로 불러오기, CreateChart를 사용하여 차트 생성, 차트 제목 및 범례 설정, Plot 메서드 호출, 그리고 Workbook을 Excel 파일로 저장.
엑셀 차트에 데이터 계열을 추가하려면 어떻게 해야 하나요?
IronXL의 AddSeries() 메서드를 사용하여 차트에 데이터 계열을 추가할 수 있습니다. 예를 들어 chart.AddSeries("A2:A7", "B2:B7")와 같이 데이터가 들어갈 셀 범위를 지정하면 해당 범위의 값으로 계열이 추가됩니다.


아직도 스크롤하고 계신가요?
빠른 증거를 원하시나요? PM > Install-Package IronXL.Excel
샘플을 실행하세요 데이터가 스프레드시트로 변환되는 것을 지켜보세요.


