


如何使用 C# 创建 Excel 图表
使用IronXL在C#中创建Excel图表,调用Plot()方法绘图——在5行代码中完成Excel可视化。
快速入门:用C#编程生成Excel图表
在 IronXL 中创建柱状图:使用单一工作表方法创建图表、添加数据序列、设置标题和图例、绘制图表并保存。 有关 IronXL.Excel 功能的全面概述,请访问我们的 Get Started Overview 页面。
-
使用 NuGet 包管理器安装 https://www.nuget.org/packages/IronXL.Excel
-
复制并运行这段代码。
IChart chart = worksheet.CreateChart(ChartType.Column, 5, 5, 20, 10); chart.AddSeries("A2:A7", "B2:B7"); chart.SetTitle("Sales Overview").SetLegendPosition(LegendPosition.Bottom).Plot(); workbook.SaveAs("SalesChart.xlsx"); -
部署到您的生产环境中进行测试
通过免费试用立即在您的项目中开始使用IronXL

最小工作流程(6 个步骤)
- 安装 Excel 库以创建 Excel 图表。
- 将现有Excel文件加载到
Workbook对象中。 - 使用
CreateChart创建图表。 4.设置图表标题和图例。 - 调用
Plot方法。 - 将
Workbook保存到Excel文件。
使用 .NET 以编程方式创建 Excel 图表
- 以编程方式创建 Excel 图表
- 添加系列标题和图例

步骤1
如何安装 IronXL.Excel 图表创建工具?
使用 Visual Studio 中的 NuGet 包管理器安装 IronXL:
- 选择"项目"菜单
- 管理 NuGet 程序包
- 搜索
IronXL.Excel - 安装
该安装提供了以编程方式创建 Excel 图表所需的所有工具。 IronXL 支持各种图表类型,包括柱状图、线图、饼图、条形图、面积图和散点图。
为什么要使用 NuGet 包管理器?
您也可以在开发人员命令提示符中输入以下命令:
Install-Package IronXL.Excel
哪些是替代安装方法?
或从此处下载:https://ironsoftware.com/csharp/excel/packages/IronXL.zip
安装后,IronXL.Excel 可让您从头开始创建新的 Excel 文件或处理现有的电子表格,既适用于新项目,也适用于遗留系统集成。
如何使用教程
如何在 .NET 中以编程方式创建 Excel 图表?
将以下数据添加到 Excel 电子表格中:
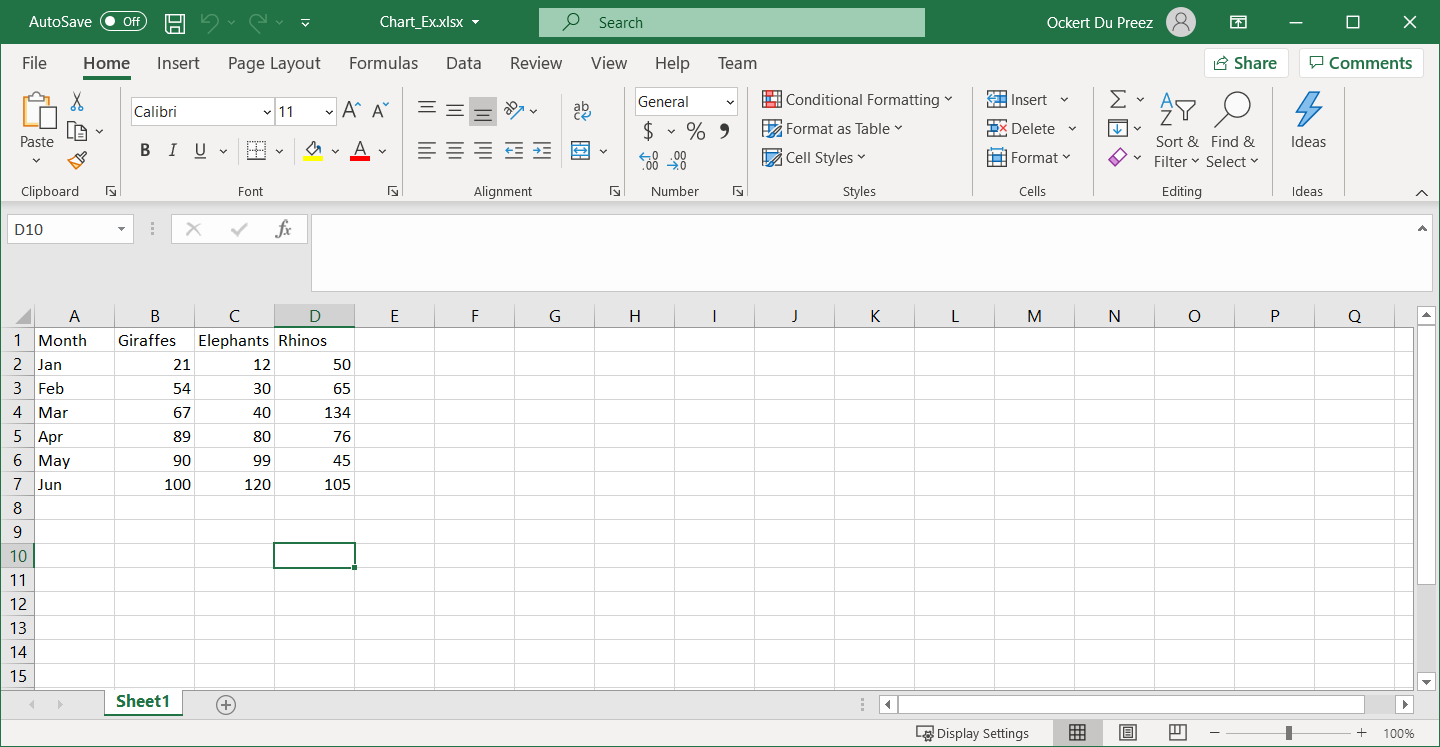
图 1 –用于绘制图表的数据
在创建图表之前,请确保您的数据组织得当。 IronXL.Excel 可以加载现有电子表格,您也可以通过编程创建电子表格。 该库支持各种 Excel 文件格式,包括 XLS、XLSX、CSV 和 TSV。
Excel 图表需要哪些命名空间?
添加必要的命名空间,以便在 IronXL.Excel 中使用 Excel 图表:
:path=/static-assets/excel/content-code-examples/how-to/csharp-create-excel-chart-programmatically-3.csusing IronXL;
using IronXL.Drawing.Charts;
Imports IronXL
Imports IronXL.Drawing.Charts这些命名空间可以访问所有与图表相关的功能。 IronXL.Drawing.Charts处理图表创建和自定义功能。
如何在图表中添加多个数据系列?
添加代码,使用 IronXL 以编程方式创建 Excel 图表:
:path=/static-assets/excel/content-code-examples/how-to/csharp-create-excel-chart-programmatically-example.csusing IronXL;
using IronXL.Drawing.Charts;
// Load the existing Excel workbook
WorkBook wb = WorkBook.Load("Chart_Ex.xlsx");
// Use the default worksheet from the workbook
WorkSheet ws = wb.DefaultWorkSheet;
// Create a column chart at the specified range of cells
var chart = ws.CreateChart(ChartType.Column, 10, 15, 25, 20);
// Define the range for the x-axis data
const string xAxis = "A2:A7";
// Add a series for the chart using data in the range and give it a title from the first row
var series = chart.AddSeries(xAxis, "B2:B7");
series.Title = ws["B1"].StringValue;
// Add another series
series = chart.AddSeries(xAxis, "C2:C7");
series.Title = ws["C1"].StringValue;
// Add a third series
series = chart.AddSeries(xAxis, "D2:D7");
series.Title = ws["D1"].StringValue;
// Set the chart title
chart.SetTitle("Column Chart");
// Position the legend at the bottom of the chart
chart.SetLegendPosition(LegendPosition.Bottom);
// Plot the chart with the provided data
chart.Plot();
// Save the workbook with the newly added chart
wb.SaveAs("Exported_Column_Chart.xlsx");Imports IronXL
Imports IronXL.Drawing.Charts
' Load the existing Excel workbook
Dim wb As WorkBook = WorkBook.Load("Chart_Ex.xlsx")
' Use the default worksheet from the workbook
Dim ws As WorkSheet = wb.DefaultWorkSheet
' Create a column chart at the specified range of cells
Dim chart = ws.CreateChart(ChartType.Column, 10, 15, 25, 20)
' Define the range for the x-axis data
Const xAxis As String = "A2:A7"
' Add a series for the chart using data in the range and give it a title from the first row
Dim series = chart.AddSeries(xAxis, "B2:B7")
series.Title = ws("B1").StringValue
' Add another series
series = chart.AddSeries(xAxis, "C2:C7")
series.Title = ws("C1").StringValue
' Add a third series
series = chart.AddSeries(xAxis, "D2:D7")
series.Title = ws("D1").StringValue
' Set the chart title
chart.SetTitle("Column Chart")
' Position the legend at the bottom of the chart
chart.SetLegendPosition(LegendPosition.Bottom)
' Plot the chart with the provided data
chart.Plot()
' Save the workbook with the newly added chart
wb.SaveAs("Exported_Column_Chart.xlsx")CreateChart方法接受图表类型和位置(左列、顶行、右列、底行)的参数。 该定位使用单元格坐标将图表精确地放置在工作表中。 您可以在一张工作表上创建多个图表,也可以将它们分散到不同的工作表中。
在处理数据系列时,IronXL.Excel 允许您使用标准 Excel 符号引用单元格区域。 这样,熟悉 Excel 的开发人员就可以直观地过渡到编程式图表创建。 此外,您还可以将图表与Excel 公式相结合,创建动态可视化效果,在数据发生变化时自动更新。
如何创建不同的图表类型?
IronXL 支持柱状图以外的各种图表类型。 下面是一个创建带有自定义样式的折线图的示例:
// Create a line chart for trend analysis
var lineChart = ws.CreateChart(ChartType.Line, 10, 22, 25, 32);

// Add data series with smooth lines
var trendSeries = lineChart.AddSeries("A2:A7", "B2:B7");
trendSeries.Title = "Q1 Sales Trend";

// Customize chart appearance
lineChart.SetTitle("Quarterly Sales Trend Analysis");
lineChart.SetLegendPosition(LegendPosition.Right);

// You can also create combination charts
var comboChart = ws.CreateChart(ChartType.ColumnClustered, 27, 15, 42, 25);
comboChart.AddSeries("A2:A7", "B2:B7"); // Column series
comboChart.AddSeries("A2:A7", "C2:C7"); // Can be styled as line

comboChart.Plot();
// Create a line chart for trend analysis
var lineChart = ws.CreateChart(ChartType.Line, 10, 22, 25, 32);
// Add data series with smooth lines
var trendSeries = lineChart.AddSeries("A2:A7", "B2:B7");
trendSeries.Title = "Q1 Sales Trend";
// Customize chart appearance
lineChart.SetTitle("Quarterly Sales Trend Analysis");
lineChart.SetLegendPosition(LegendPosition.Right);
// You can also create combination charts
var comboChart = ws.CreateChart(ChartType.ColumnClustered, 27, 15, 42, 25);
comboChart.AddSeries("A2:A7", "B2:B7"); // Column series
comboChart.AddSeries("A2:A7", "C2:C7"); // Can be styled as line
comboChart.Plot();' Create a line chart for trend analysis
Dim lineChart = ws.CreateChart(ChartType.Line, 10, 22, 25, 32)
' Add data series with smooth lines
Dim trendSeries = lineChart.AddSeries("A2:A7", "B2:B7")
trendSeries.Title = "Q1 Sales Trend"
' Customize chart appearance
lineChart.SetTitle("Quarterly Sales Trend Analysis")
lineChart.SetLegendPosition(LegendPosition.Right)
' You can also create combination charts
Dim comboChart = ws.CreateChart(ChartType.ColumnClustered, 27, 15, 42, 25)
comboChart.AddSeries("A2:A7", "B2:B7") ' Column series
comboChart.AddSeries("A2:A7", "C2:C7") ' Can be styled as line
comboChart.Plot()最终图表输出是什么样的?
创建了一个Worksheet对象。 调用CreateChart方法指定图表类型和图表位置。 图表的序列会添加标题和图例。
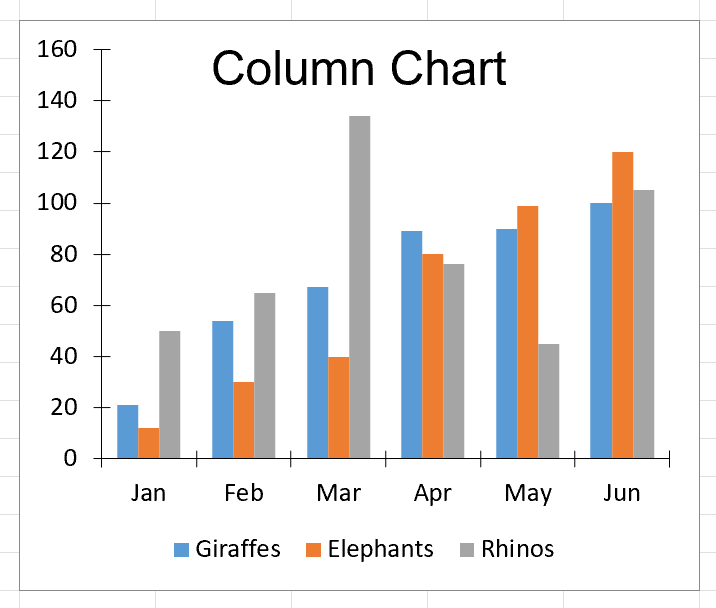
图 2 –图表输出
最终的图表可以清晰直观地展示您的数据。 IronXL.Excel 可在幕后处理所有复杂的 Excel XML 格式,让您专注于业务逻辑。 有关创建图表的更多示例,请查看我们的 Excel 图表示例页面。
高级图表定制
除了基本的图表创建外,IronXL 还提供广泛的自定义选项。 您可以修改颜色、添加数据标签、调整坐标轴比例并应用各种格式化选项。 该库的保存和导出功能可确保您的图表在不同的 Excel 格式和版本中得到正确保存。
在处理大型数据集时,请考虑在创建图表前实施分页或数据过滤。 这种方法可确保最佳性能,并防止可视化效果杂乱无章。 IronXL.Excel 的高效内存管理使您可以处理大量 Excel 文件而不会降低性能。
库快速访问
IronXL API 参考文档
Learn more and share how to merge, unmerge, and work with cells in Excel spreadsheets using the handy [IronXL API 参考文档](https://ironsoftware.com/csharp/excel/object-reference/api/).
IronXL API 参考文档
常见问题解答
如何用 C# 编程创建 Excel 图表?
通过调用 CreateChart() 方法、使用 AddSeries() 添加数据序列、配置标题和图例,然后使用 Plot() 方法绘制图表,您就可以使用 IronXL.Excel 在 C# 中创建 Excel 图表。整个过程只需 5 行代码即可完成。
我可以在 Excel 中以编程方式创建哪些图表类型?
IronXL 支持在 C# 应用程序中以编程方式创建各种图表类型,包括柱状图、折线图、饼图、条形图、面积图和散点图。
如何安装在 C# 中创建 Excel 图表的库?
using Visual Studio 中的 NuGet 包管理器安装 IronXL,方法是选择项目菜单 > 管理 NuGet 包 > 搜索 IronXL.Excel > 安装。它提供了以编程方式创建 Excel 图表所需的所有工具。
我能否为通过程序创建的 Excel 图表添加标题和图例?
是的,IronXL 允许您使用 SetTitle() 方法设置图表标题,使用 SetLegendPosition() 方法配置图例位置,让您完全控制图表的外观和布局。
Excel 图表创建支持哪些文件格式?
IronXL 支持各种 Excel 文件格式,包括 XLS、XLSX、CSV 和 TSV,因此在以编程方式创建图表时,您既可以使用现代 Excel 文件,也可以使用传统 Excel 文件。
我可以用现有的 Excel 数据创建图表吗,还是需要创建新的电子表格?
IronXL 既可以加载现有电子表格,也可以从头开始以编程方式创建电子表格,因此在生成 Excel 图表时,它既适用于新项目,也适用于遗留系统集成。
用 C# 创建 Excel 图表的基本工作流程是什么?
IronXL 的最小工作流程包括 6 个步骤:安装 Excel 库,将 Excel 文件加载到 Workbook 对象中,使用 CreateChart 创建图表,设置图表标题和图例,调用 Plot 方法,将 Workbook 保存为 Excel 文件。
如何在 Excel 图表中添加数据序列?
using IronXL 中的 AddSeries() 方法为图表添加数据系列,方法是指定数据的单元格区域,如 chart.AddSeries("A2:A7", "B2:B7"),以添加包含这些区域值的系列。


还在滚动吗?
想快速获得证据? PM > Install-Package IronXL.Excel
运行示例 观看您的数据变成电子表格。


