


Cómo usar C# para crear gráficos de Excel
Crea gráficos de Excel en C# usando IronXL llamando al método CreateChart(), agregando series de datos con AddSeries(), configurando título y leyenda, luego trazando con el método Plot() - visualización completa de Excel en 5 líneas de código.
Inicio rápido: Generar Programáticamente un Gráfico de Excel en C#
Cree un gráfico de columnas en IronXL: utilice un método de una sola hoja de cálculo para crear el gráfico, agregar una serie de datos, establecer el título y la leyenda, trazarlo y guardarlo. Para obtener una descripción general completa de las capacidades de IronXL, visite nuestra página Get Started Overview.
-
Instala IronXL con el Administrador de Paquetes NuGet
PM > Install-Package IronXL.Excel -
Copie y ejecute este fragmento de código.
IChart chart = worksheet.CreateChart(ChartType.Column, 5, 5, 20, 10); chart.AddSeries("A2:A7", "B2:B7"); chart.SetTitle("Sales Overview").SetLegendPosition(LegendPosition.Bottom).Plot(); workbook.SaveAs("SalesChart.xlsx"); -
Despliegue para probar en su entorno real
Comienza a usar IronXL en tu proyecto hoy mismo con una prueba gratuita

Flujo de trabajo mínimo (6 pasos)
- Instale la biblioteca de Excel para crear gráficos de Excel.
- Carga el archivo de Excel existente en un objeto
Workbook. - Crea un gráfico con
CreateChart. - Defina el título y la leyenda del gráfico.
- Llama al método
Plot. - Guarda el
Workbooken el archivo de Excel.
Crear gráficos de Excel mediante programación en .NET
- Crear gráficos de Excel mediante programación
- Añadir serie con título y leyenda

Paso 1
¿Cómo instalo IronXL para la creación de gráficos de Excel?
Instale IronXL utilizando el gestor de paquetes NuGet en Visual Studio:
- Seleccione el menú Proyecto
- Administrar paquetes NuGet
- Busca
IronXl.Excel. - Instalar
Esta instalación proporciona todas las herramientas necesarias para crear gráficos de Excel mediante programación. IronXL es compatible con varios tipos de gráficos: de columnas, de líneas, circulares, de barras, de áreas y de dispersión.
¿Por qué debería usar NuGet Package Manager?
También puede introducir el siguiente comando en el símbolo del sistema para desarrolladores:
Install-Package IronXL.Excel
¿Cuáles son los métodos de instalación alternativos?
Or download from here: https://ironsoftware.com/csharp/excel/packages/IronXL.zip
Una vez instalado, IronXL permite crear nuevos archivos de Excel desde cero o trabajar con hojas de cálculo existentes, adecuado tanto para nuevos proyectos como para la integración de sistemas heredados.
Tutorial de cómo hacerlo
¿Cómo crear gráficos de Excel mediante programación en .NET?
Añade los siguientes datos a una hoja de cálculo de Excel:
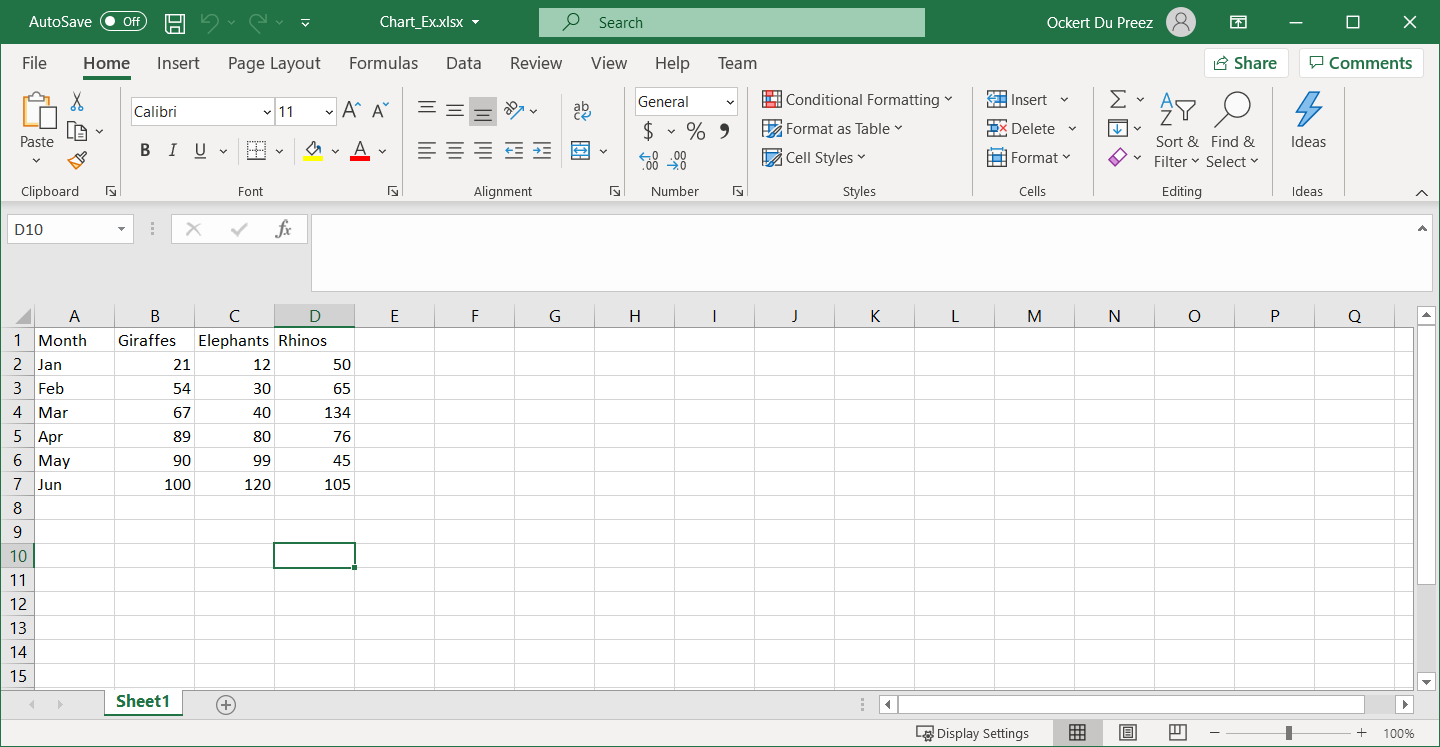
Figura 1 – Datos que se utilizarán para la elaboración de gráficos
Antes de crear gráficos, asegúrate de que los datos están bien organizados. IronXL puede cargar hojas de cálculo existentes o puede crearlas mediante programación. La biblioteca es compatible con varios formatos de archivo de Excel, incluidos XLS, XLSX, CSV y TSV.
¿Qué espacios de nombres son necesarios para los gráficos de Excel?
Agregue los espacios de nombres necesarios para trabajar con gráficos de Excel en IronXL:
using IronXL;
using IronXl.Drawing.Charts;
using IronXL;
using IronXl.Drawing.Charts;Imports IronXL
Imports IronXl.Drawing.ChartsEstos espacios de nombres proporcionan acceso a todas las funciones relacionadas con los gráficos. El espacio de nombres IronXL contiene operaciones principales de libro de trabajo y hoja de cálculo, mientras que IronXl.Drawing.Charts maneja la creación y personalización de gráficos.
¿Cómo añado varias series de datos a mi gráfico?
Agregue código para crear el gráfico de Excel programáticamente con IronXL:
:path=/static-assets/excel/content-code-examples/how-to/csharp-create-excel-chart-programmatically-example.csusing IronXL;
using IronXL.Drawing.Charts;
// Load the existing Excel workbook
WorkBook wb = WorkBook.Load("Chart_Ex.xlsx");
// Use the default worksheet from the workbook
WorkSheet ws = wb.DefaultWorkSheet;
// Create a column chart at the specified range of cells
var chart = ws.CreateChart(ChartType.Column, 10, 15, 25, 20);
// Define the range for the x-axis data
const string xAxis = "A2:A7";
// Add a series for the chart using data in the range and give it a title from the first row
var series = chart.AddSeries(xAxis, "B2:B7");
series.Title = ws["B1"].StringValue;
// Add another series
series = chart.AddSeries(xAxis, "C2:C7");
series.Title = ws["C1"].StringValue;
// Add a third series
series = chart.AddSeries(xAxis, "D2:D7");
series.Title = ws["D1"].StringValue;
// Set the chart title
chart.SetTitle("Column Chart");
// Position the legend at the bottom of the chart
chart.SetLegendPosition(LegendPosition.Bottom);
// Plot the chart with the provided data
chart.Plot();
// Save the workbook with the newly added chart
wb.SaveAs("Exported_Column_Chart.xlsx");Imports IronXL
Imports IronXL.Drawing.Charts
' Load the existing Excel workbook
Dim wb As WorkBook = WorkBook.Load("Chart_Ex.xlsx")
' Use the default worksheet from the workbook
Dim ws As WorkSheet = wb.DefaultWorkSheet
' Create a column chart at the specified range of cells
Dim chart = ws.CreateChart(ChartType.Column, 10, 15, 25, 20)
' Define the range for the x-axis data
Const xAxis As String = "A2:A7"
' Add a series for the chart using data in the range and give it a title from the first row
Dim series = chart.AddSeries(xAxis, "B2:B7")
series.Title = ws("B1").StringValue
' Add another series
series = chart.AddSeries(xAxis, "C2:C7")
series.Title = ws("C1").StringValue
' Add a third series
series = chart.AddSeries(xAxis, "D2:D7")
series.Title = ws("D1").StringValue
' Set the chart title
chart.SetTitle("Column Chart")
' Position the legend at the bottom of the chart
chart.SetLegendPosition(LegendPosition.Bottom)
' Plot the chart with the provided data
chart.Plot()
' Save the workbook with the newly added chart
wb.SaveAs("Exported_Column_Chart.xlsx")El método CreateChart toma parámetros para el tipo de gráfico y la posición (columna izquierda, fila superior, columna derecha, fila inferior). Este posicionamiento utiliza coordenadas de celda para colocar con precisión el gráfico dentro de la hoja de cálculo. Puede crear varios gráficos en una sola hoja de cálculo o distribuirlos en hojas diferentes.
Al trabajar con series de datos, IronXL permite hacer referencia a rangos de celdas utilizando la notación estándar de Excel. De este modo, la transición a la creación programática de gráficos resulta intuitiva para los desarrolladores familiarizados con Excel. Además, puedes combinar gráficos con fórmulas de Excel para crear visualizaciones dinámicas que se actualicen automáticamente cuando cambien los datos.
¿Cómo puedo crear distintos tipos de gráficos?
IronXL admite varios tipos de gráficos además de los gráficos de columnas. He aquí un ejemplo de creación de un gráfico de líneas con estilo personalizado:
// Create a line chart for trend analysis
var lineChart = ws.CreateChart(ChartType.Line, 10, 22, 25, 32);

// Add data series with smooth lines
var trendSeries = lineChart.AddSeries("A2:A7", "B2:B7");
trendSeries.Title = "Q1 Sales Trend";

// Customize chart appearance
lineChart.SetTitle("Quarterly Sales Trend Analysis");
lineChart.SetLegendPosition(LegendPosition.Right);

// You can also create combination charts
var comboChart = ws.CreateChart(ChartType.ColumnClustered, 27, 15, 42, 25);
comboChart.AddSeries("A2:A7", "B2:B7"); // Column series
comboChart.AddSeries("A2:A7", "C2:C7"); // Can be styled as line

comboChart.Plot();
// Create a line chart for trend analysis
var lineChart = ws.CreateChart(ChartType.Line, 10, 22, 25, 32);
// Add data series with smooth lines
var trendSeries = lineChart.AddSeries("A2:A7", "B2:B7");
trendSeries.Title = "Q1 Sales Trend";
// Customize chart appearance
lineChart.SetTitle("Quarterly Sales Trend Analysis");
lineChart.SetLegendPosition(LegendPosition.Right);
// You can also create combination charts
var comboChart = ws.CreateChart(ChartType.ColumnClustered, 27, 15, 42, 25);
comboChart.AddSeries("A2:A7", "B2:B7"); // Column series
comboChart.AddSeries("A2:A7", "C2:C7"); // Can be styled as line
comboChart.Plot();' Create a line chart for trend analysis
Dim lineChart = ws.CreateChart(ChartType.Line, 10, 22, 25, 32)
' Add data series with smooth lines
Dim trendSeries = lineChart.AddSeries("A2:A7", "B2:B7")
trendSeries.Title = "Q1 Sales Trend"
' Customize chart appearance
lineChart.SetTitle("Quarterly Sales Trend Analysis")
lineChart.SetLegendPosition(LegendPosition.Right)
' You can also create combination charts
Dim comboChart = ws.CreateChart(ChartType.ColumnClustered, 27, 15, 42, 25)
comboChart.AddSeries("A2:A7", "B2:B7") ' Column series
comboChart.AddSeries("A2:A7", "C2:C7") ' Can be styled as line
comboChart.Plot()¿Qué aspecto tiene el gráfico final?
Se crean un objeto Workbook y un objeto Worksheet. Se llama al método CreateChart del objeto Worksheet para especificar el tipo y ubicación del gráfico. Las series del gráfico se añaden con título y leyenda.
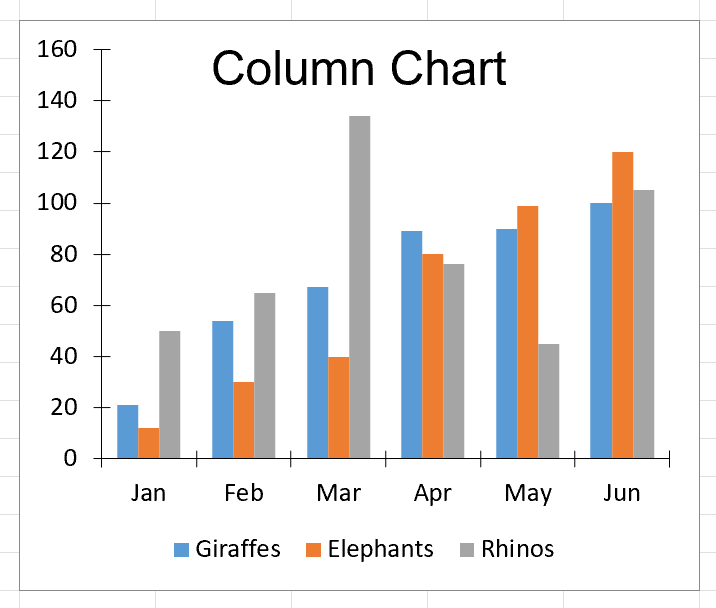
Figura 2 – Salida del gráfico
El gráfico resultante ofrece una representación visual clara de sus datos. IronXL maneja todo el complejo formato XML de Excel entre bastidores, lo que le permite centrarse en su lógica de negocio. Para ver más ejemplos de creación de gráficos, consulta nuestra página Ejemplos de gráficos Excel.
Personalización avanzada de gráficos
Más allá de la creación básica de gráficos, IronXL ofrece amplias opciones de personalización. Puede modificar los colores, añadir etiquetas de datos, ajustar las escalas de los ejes y aplicar varias opciones de formato. Las funciones Guardar y exportar de la biblioteca garantizan que los gráficos se conserven correctamente en distintos formatos y versiones de Excel.
Cuando trabaje con grandes conjuntos de datos, considere la posibilidad de aplicar la paginación o el filtrado de datos antes de crear el gráfico. Este enfoque garantiza un rendimiento óptimo y evita visualizaciones recargadas. La eficiente gestión de memoria de IronXL le permite trabajar con archivos Excel sustanciales sin degradación del rendimiento.
Acceso rápido a la biblioteca
Documentación de referencia de la API de IronXL
Learn more and share how to merge, unmerge, and work with cells in Excel spreadsheets using the handy [Documentación de referencia de la API de IronXL](https://ironsoftware.com/csharp/excel/object-reference/api/).
Documentación de referencia de la API de IronXL
Preguntas Frecuentes
¿Cómo puedo crear un gráfico de Excel mediante programación en C#?
Puede crear gráficos de Excel en C# utilizando IronXL llamando al método CreateChart(), agregando series de datos con AddSeries(), configurando el título y la leyenda, y luego trazando con el método Plot(). Todo el proceso se puede completar en sólo 5 líneas de código.
¿Qué tipos de gráficos puedo crear mediante programación en Excel?
IronXL admite la creación de varios tipos de gráficos, incluidos gráficos de columnas, gráficos de líneas, gráficos circulares, gráficos de barras, gráficos de áreas y gráficos de dispersión mediante programación en sus aplicaciones de C#.
¿Cómo se instala una biblioteca para crear gráficos de Excel en C#?
Instale IronXL utilizando el Administrador de paquetes NuGet en Visual Studio seleccionando el menú Proyecto > Administrar paquetes NuGet > Buscar IronXL.Excel > Instalar. Esto proporciona todas las herramientas necesarias para crear gráficos de Excel mediante programación.
¿Puedo añadir títulos y leyendas a mis gráficos Excel creados mediante programación?
Sí, IronXL le permite establecer títulos de gráficos utilizando el método SetTitle() y configurar posiciones de leyenda con el método SetLegendPosition(), lo que le da un control total sobre la apariencia y el diseño de su gráfico.
¿Qué formatos de archivo son compatibles con la creación de gráficos en Excel?
IronXL es compatible con varios formatos de archivo de Excel, incluidos XLS, XLSX, CSV y TSV, lo que le permite trabajar con archivos de Excel modernos y heredados al crear gráficos mediante programación.
¿Puedo crear gráficos a partir de datos existentes de Excel o tengo que crear hojas de cálculo nuevas?
IronXL permite tanto cargar hojas de cálculo existentes como crearlas mediante programación desde cero, lo que lo hace adecuado tanto para nuevos proyectos como para la integración de sistemas heredados a la hora de generar gráficos de Excel.
¿Cuál es el flujo de trabajo básico para crear un gráfico de Excel en C#?
El flujo de trabajo mínimo con IronXL consta de 6 pasos: Instalar la biblioteca de Excel, cargar el archivo de Excel en un objeto Workbook, crear un gráfico con CreateChart, establecer el título y la leyenda del gráfico, llamar al método Plot y guardar el Workbook en el archivo de Excel.
¿Cómo añado series de datos a mi gráfico de Excel?
Utilice el método AddSeries() en IronXL para agregar series de datos a su gráfico especificando los rangos de celdas para sus datos, como chart.AddSeries("A2:A7", "B2:B7") para agregar una serie con valores de estos rangos.


¿Aún desplazándote?
¿Quieres una prueba rápida? PM > Install-Package IronXL.Excel
ejecuta una muestra observa cómo tus datos se convierten en una hoja de cálculo.


